
Figure 1 .
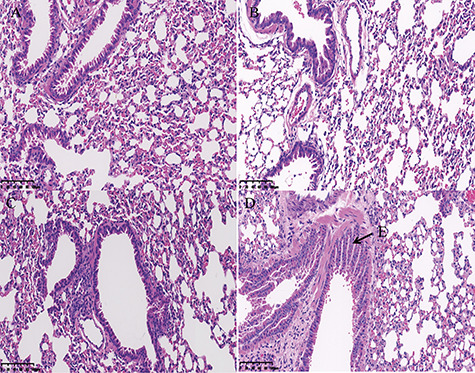
Histopathological analyses of the mouse lung. (A) Control group, (B) 10 mg/kg DIOB, (C) 30 mg/kg DIOB, and (D) 60 mg/kg DIOB. (E) bronchial epithelial hyperplasia appeared in the lungs.
Official websites use .gov
A
.gov website belongs to an official
government organization in the United States.
Secure .gov websites use HTTPS
A lock (
) or https:// means you've safely
connected to the .gov website. Share sensitive
information only on official, secure websites.
Histopathological analyses of the mouse lung. (A) Control group, (B) 10 mg/kg DIOB, (C) 30 mg/kg DIOB, and (D) 60 mg/kg DIOB. (E) bronchial epithelial hyperplasia appeared in the lungs.