
Figure 4 .
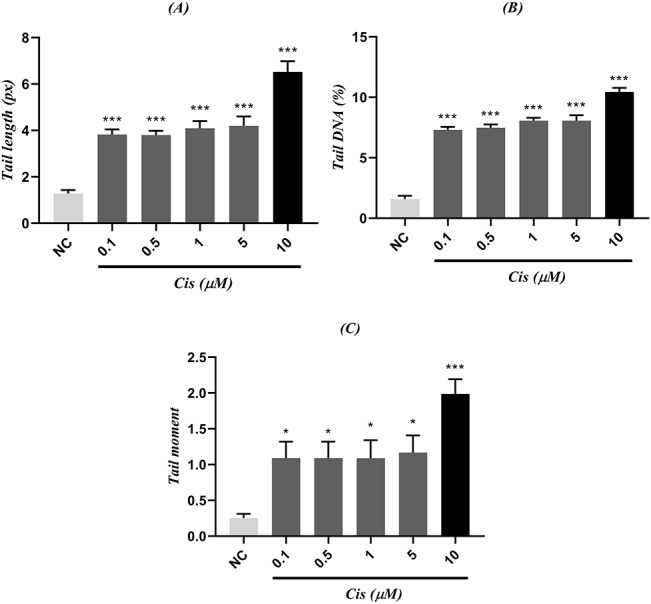
comparison between (A) tail length, (B) tail DNA, (C) tail moment of different concentrations from cisplatin (Cis) and NC; NCs are cells that received nothing but cell medium; each group is being represented as mean ± SEM (n = 3); signs (*) and (***) show statistical significance difference (P < 0.05, and P < 0.001, respectively) compared to NC.