
Figure 6 .
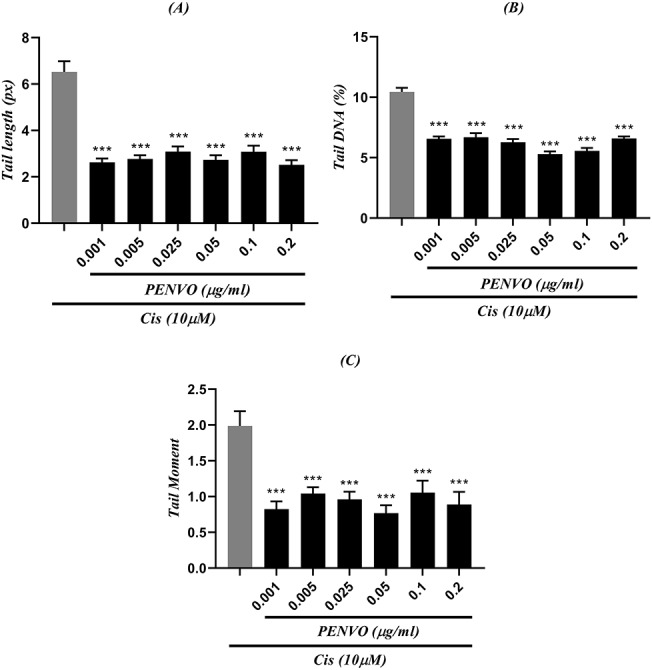
comparison between (A) tail length, (B) tail DNA, and (C) tail moment of cisplatin (Cis) with different concentrations of PENVO and positive control (first column which represents cells that only received cisplatin with a concentration of 15 μM); each group is being represented as mean ± SEM (n = 3); sign (***) shows statistical significance difference (P < 0.001) compared to positive control.