
Figure 8 .
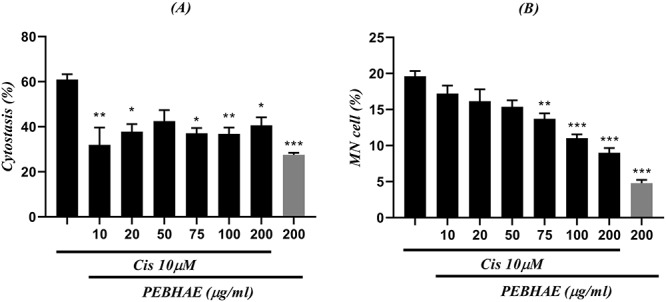
results obtained from (A) cytostasis (%) and (B) MN/total cell ratio are presented in this figure; each chart compares cells treated with both cisplatin (Cis) and different concentrations of PEBHAE and positive control (first column of both charts which shows cells that were treated with just 10 μM of cisplatin); data are presented as mean ± SD (n = 3); signs (*), (**), and (***) represent statistically significant difference (P < 0.05, P < 0.01, and P < 0.001, respectively) compared to cisplatin