
Figure 2.
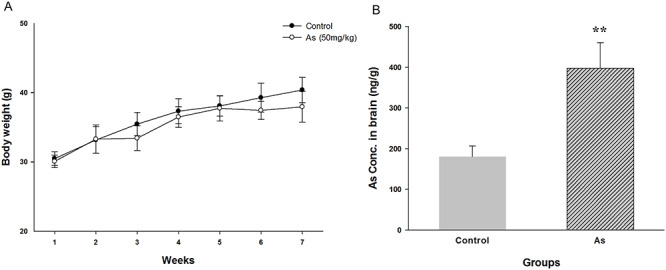
Changes of body weight throughout the experiment (A) and As concentrations in brain (B). Results are expressed as mean ± SEM (n = 8). **P < 0.01 when compared with control group.
Official websites use .gov
A
.gov website belongs to an official
government organization in the United States.
Secure .gov websites use HTTPS
A lock (
) or https:// means you've safely
connected to the .gov website. Share sensitive
information only on official, secure websites.
Changes of body weight throughout the experiment (A) and As concentrations in brain (B). Results are expressed as mean ± SEM (n = 8). **P < 0.01 when compared with control group.