
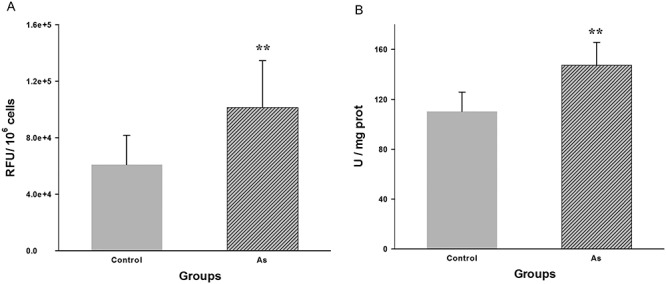
Figure 4.
Comparison of mean level of ROS generation (A) and SOD activity (B) in hippocampus between NaAsO2-exposed and control group. Values are expressed as mean ± SEM (n = 5). **P < 0.01 when compared with control group.
Official websites use .gov
A
.gov website belongs to an official
government organization in the United States.
Secure .gov websites use HTTPS
A lock (
) or https:// means you've safely
connected to the .gov website. Share sensitive
information only on official, secure websites.
Comparison of mean level of ROS generation (A) and SOD activity (B) in hippocampus between NaAsO2-exposed and control group. Values are expressed as mean ± SEM (n = 5). **P < 0.01 when compared with control group.