
Figure 6.
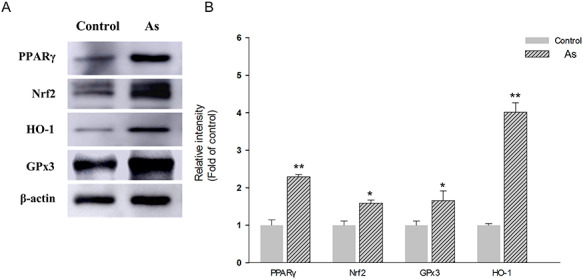
Western blot analysis showing the expression of oxidative stress markers in hippocampus of control and NaAsO2 exposed mice. Representative images of immunoblottings (A), and relative protein levels of PPARγ, Nrf2, HO-1 and GPx3 (B). For internal control, β-actin was used. Results were expressed as mean ± SEM (n = 3). *P < 0.05, **P < 0.01 when compared with control group.