
Figure 2.
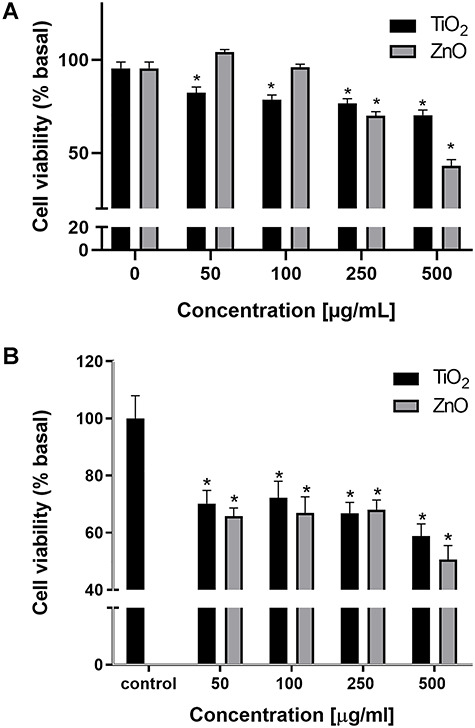
Effect on cell viability of TiO2 and ZnO NPs in A549 cells (A) and MRC-5 cells (B). Asterisks represent statistically significant difference with solvent control (*p < 0.05).
Official websites use .gov
A
.gov website belongs to an official
government organization in the United States.
Secure .gov websites use HTTPS
A lock (
) or https:// means you've safely
connected to the .gov website. Share sensitive
information only on official, secure websites.
Effect on cell viability of TiO2 and ZnO NPs in A549 cells (A) and MRC-5 cells (B). Asterisks represent statistically significant difference with solvent control (*p < 0.05).