
Figure 4.
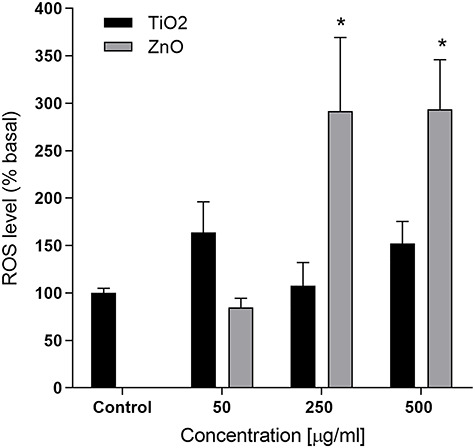
Effect of ROS induction by TiO2 or ZnO NPs in A549 cells. Asterisks (*) represent statistically significant difference with solvent control p < 0.05).
Official websites use .gov
A
.gov website belongs to an official
government organization in the United States.
Secure .gov websites use HTTPS
A lock (
) or https:// means you've safely
connected to the .gov website. Share sensitive
information only on official, secure websites.
Effect of ROS induction by TiO2 or ZnO NPs in A549 cells. Asterisks (*) represent statistically significant difference with solvent control p < 0.05).