
Figure 2:
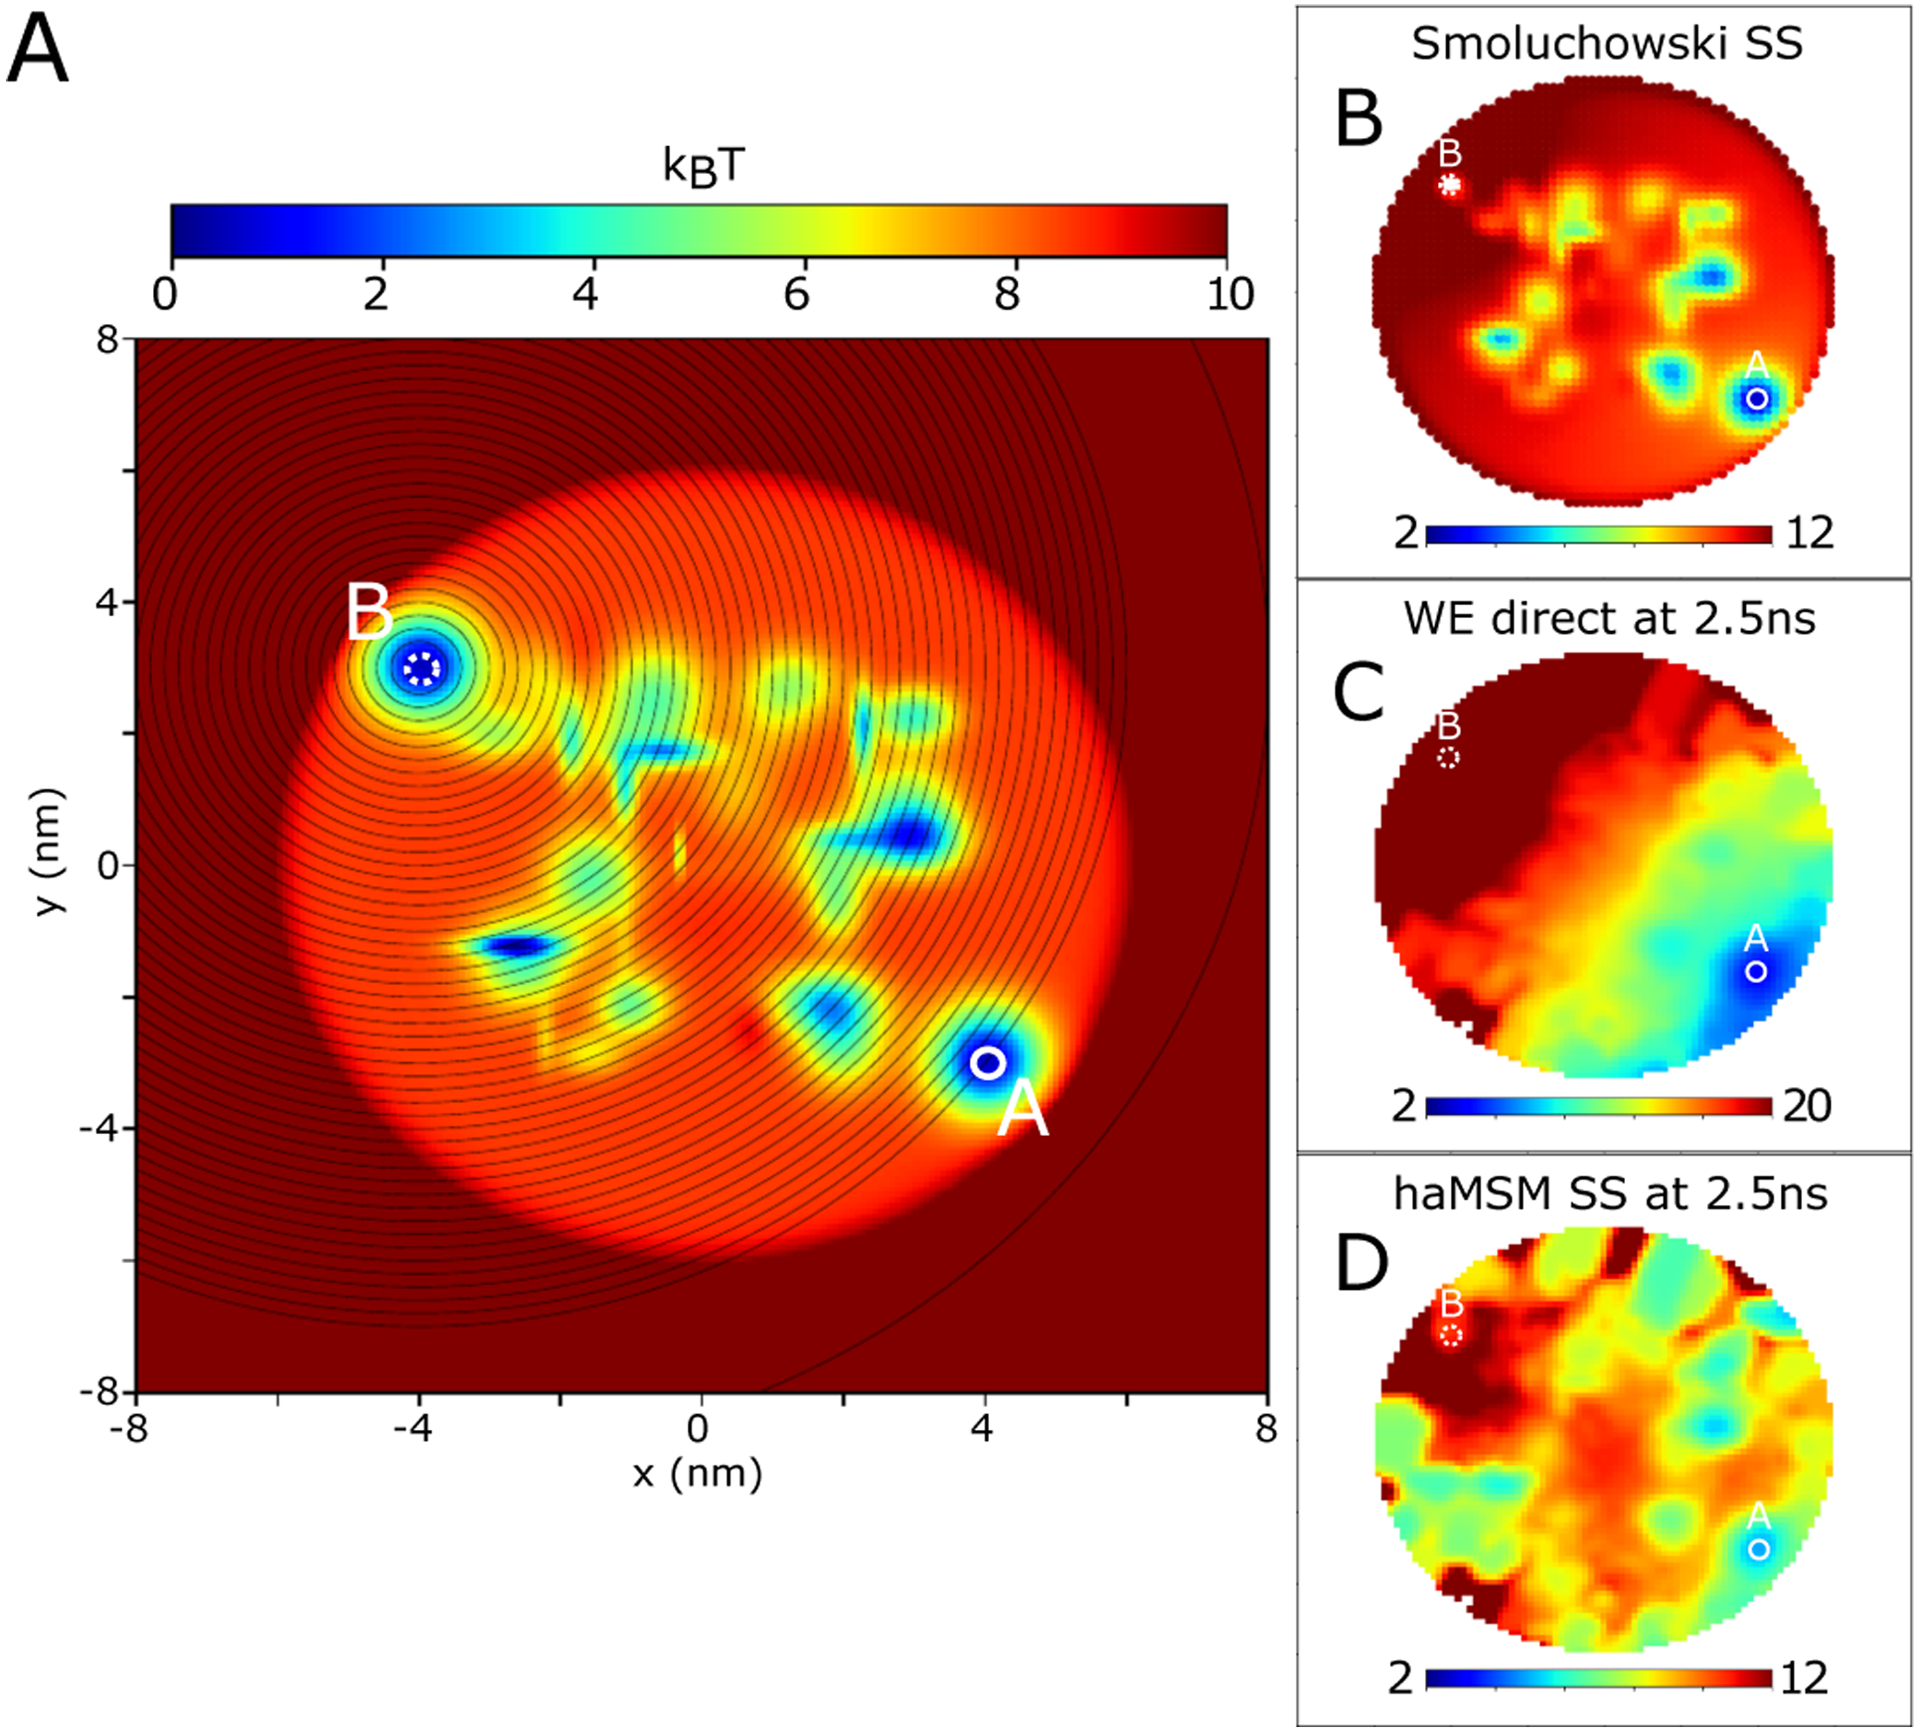
2D random energy landscape and distributions. A Potential energy in the domain (units of kBT at T = 300K) with source (A) and sink (B) states labeled, and weighted ensemble binning of the distance to the sink (black lines). B SS distribution −log pSS of the one-way feedback process from numerical solution of the Smoluchowski equation. C Transient distribution −log p(t) from WE simulation at roughly 1/50 of the SS relaxation time, t = 2.5ns (MFPT ~ 1.0μs). D haMSM estimated SS distribution −log pSS using WE simulation training set up to t = 2.5ns. 2D images from WE distributions have been smoothed with a 1 pixel gaussian kernel for visual clarity.