
Figure 8:
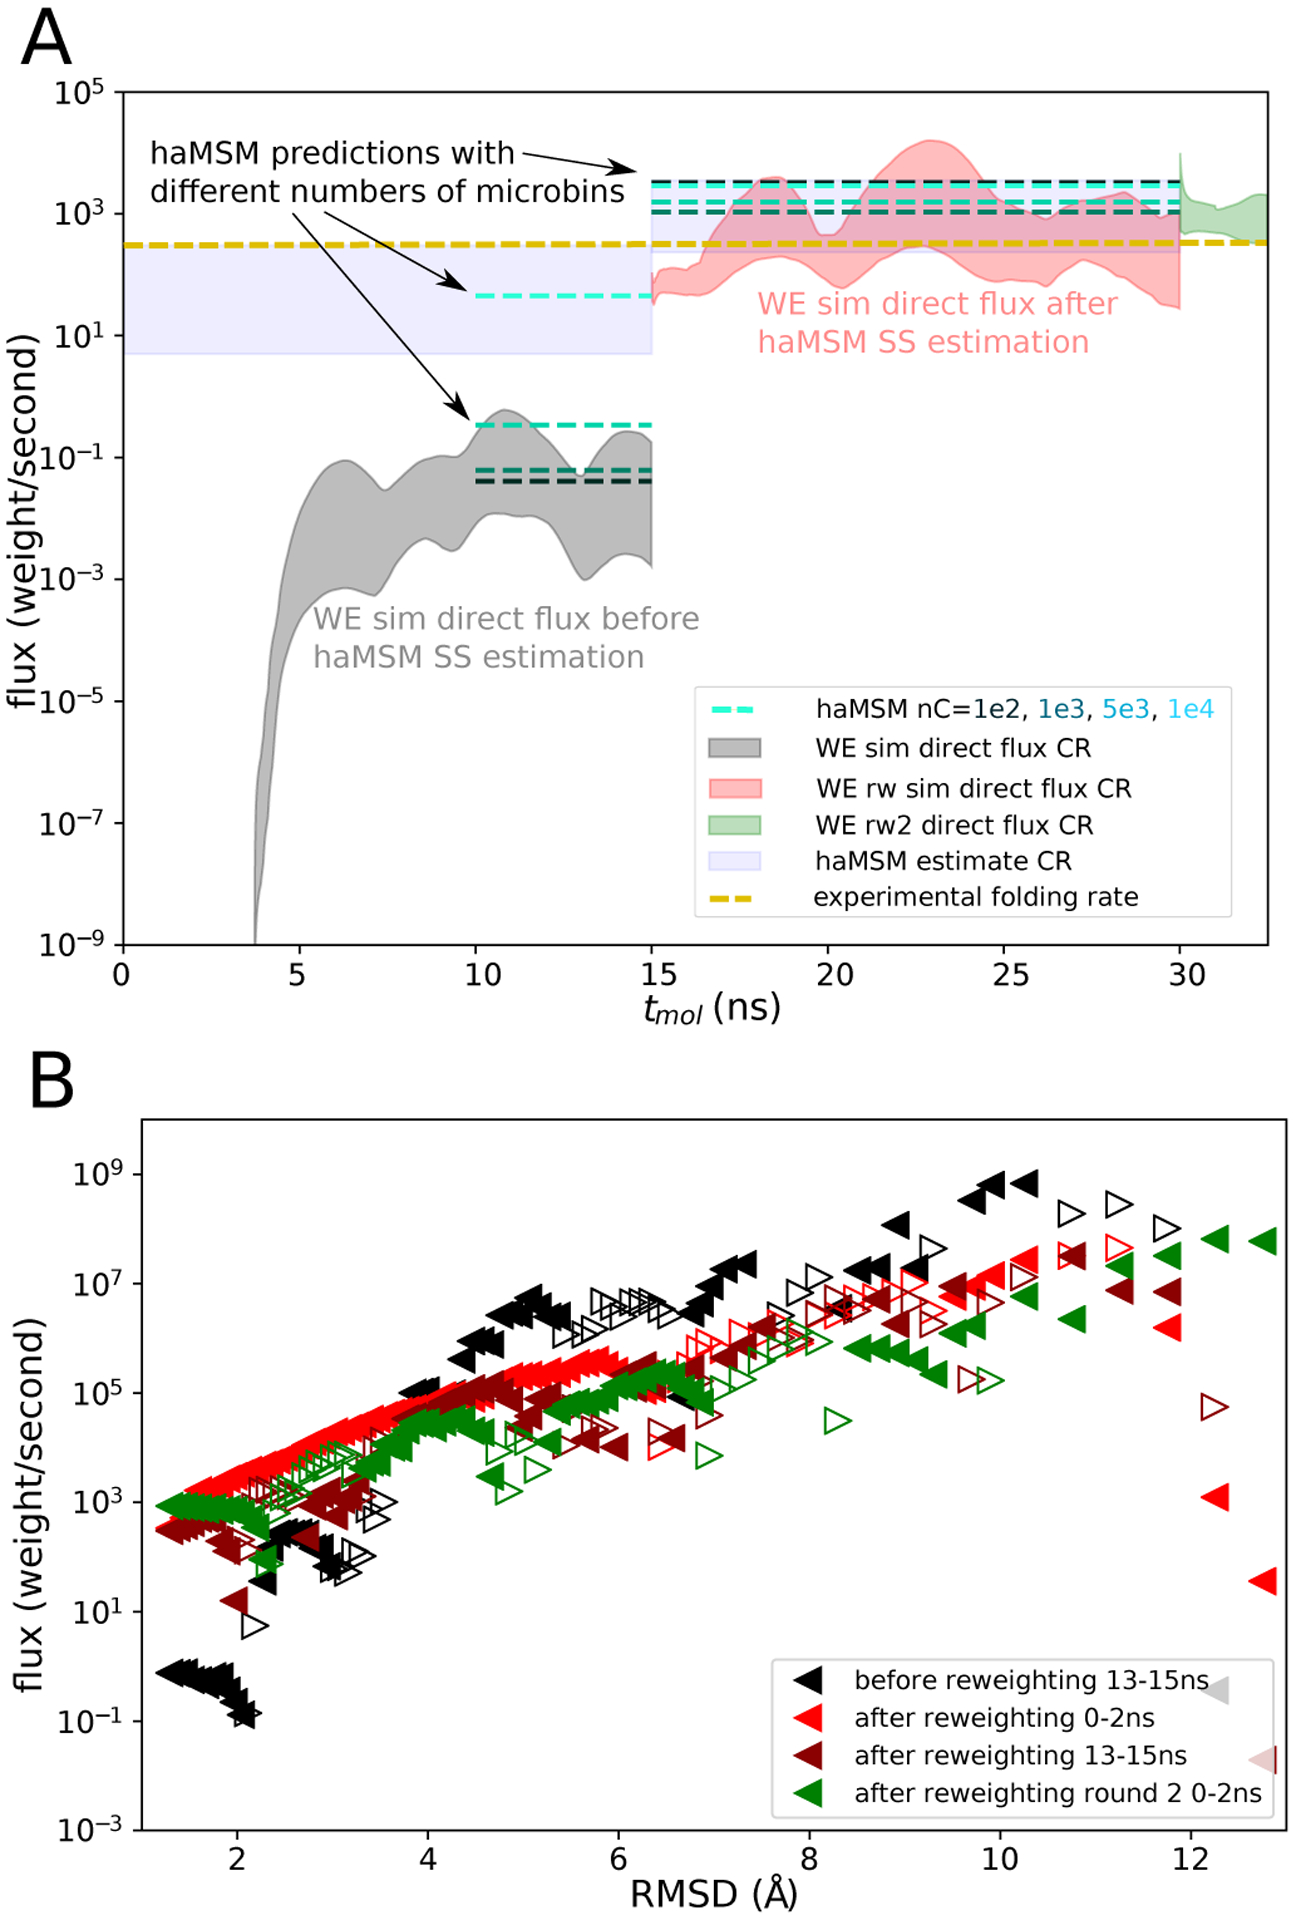
Protein G (low-friction) folding target flux and current profile. A Flux into the folded state as a function of tmol. Direct flux CR from a set of 15 2D-WE simulations initialized from the unfolded state (shaded gray) and the direct flux CR from a set of 15 reweighted/restarted (rw1) 1D-WE simulations initialized in the haMSM estimated SS (shaded red). A second set of 15 reweighted/restarted (rw2) 1D-WE simulations initialized in the haMSM estimated SS (shaded green) with rw1 as training data. haMSM estimated SS flux with 100, 1000, 5000, and 10,000 microbins (blue - light green dashed lines) and CR reflecting the variation between individual WE runs and haMSM analysis (with 10,0000 microbins) plotted within their respective training windows, and experimental folding rate at pH 4.0 (gold dashed line). B Flux profile along the RMSD to the folded state before haMSM reweighting (black triangles) and after reweighting (red triangles). Flux profile at the end of rw1 simulations (maroon triangles) and beginning of rw2 simulations (green triangles). Filled left-pointing triangles depict flux directed towards the target, and empty right-pointing triangles depict flux directed away from the target.