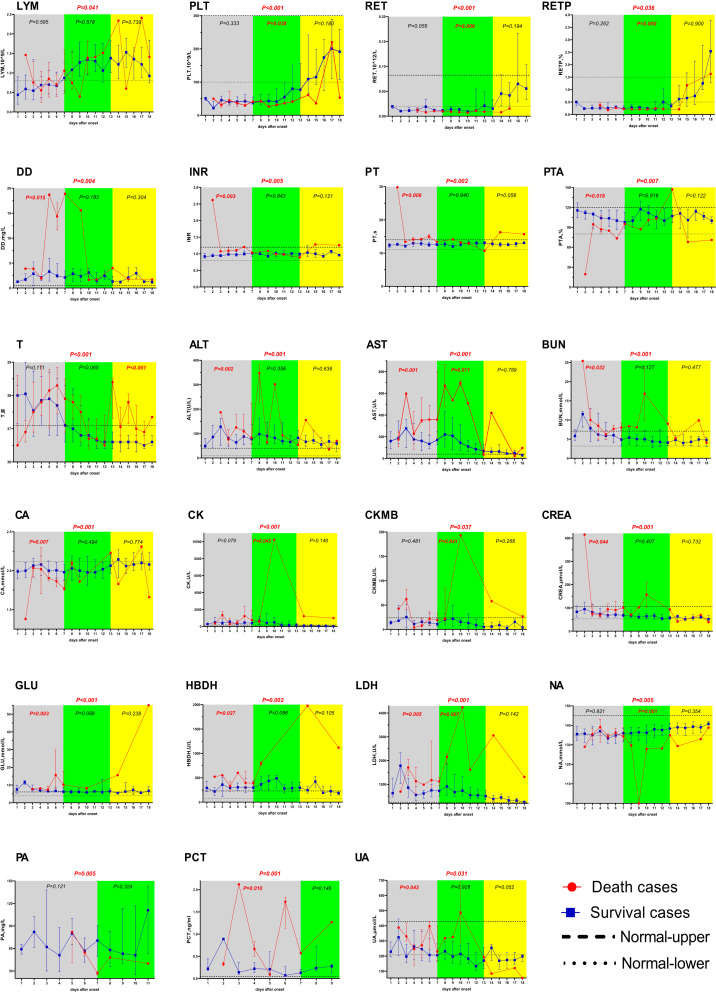
Figure 1.
Data are expressed as median and interquartile range for LYM, PLT, RET, RETP, DD, INR, PT, PTA, T, ALT, AST, BUN, Ca, CK, CKMB, CREA, GLU, HBDH, lactate dehydrogenase, Na, PA, PCT, and uric acid. P values are the results of univariate analysis for comparison between the groups. The yellow and green square frames represent the early and middle stages of clinical progression, respectively. The fatal cases are represented by the red line; the nonfatal cases are represented by the blue line. Normal upper: the upper limit of the normal value range. Normal lower: the lower limit of the normal value range. ALT = alanine transaminase; AST = aspartate aminotransferase; BUN = blood urea nitrogen; Ca = calcium; CK = creatine kinase; CKMB = creatine kinase-MB; CREA = creatinine; GLU = glucose; HBDH = hydroxybutyrate dehydrogenase; LDH = lactate dehydrogenase; Na = Natrium; PA = prealbumin; PCT = procalcitonin; LYM = lymphocyte; PLT = platelet; RET = reticulocyte; RETP = reticulocyte count percentage; T = temperature; DD = D-dimer; INR = international normalized ratio; PT = prothrombin time; PTA = prothrombin time activity; UA = uric acid.

