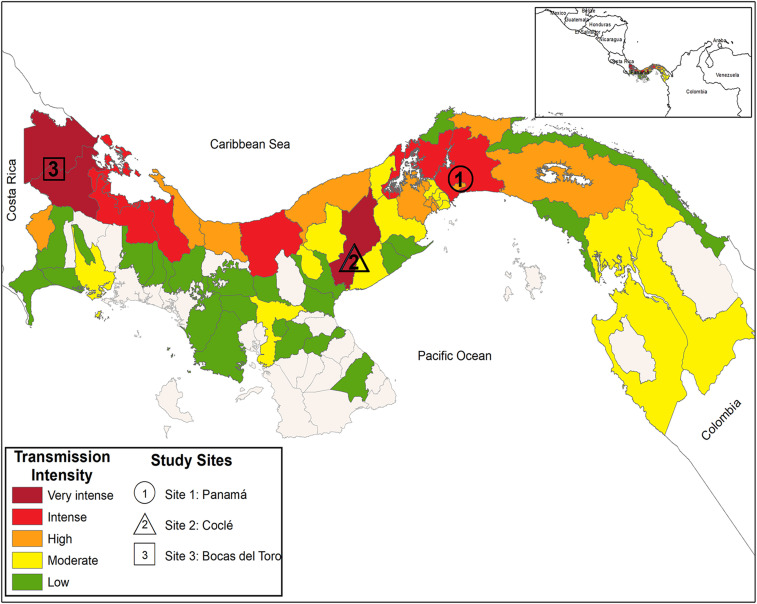
Figure 1.
Map of Panama showing location of the study sites and the cutaneous leishmaniasis transmission intensity based on the median number of confirmed cases (2015–2017). Map was created using ArcGIS Desktop 10.6.1 software (ArcGIS Desktop© 10.6.1 software, 2018, Redlands, CA). Data were obtained from information reported by the Panamanian Ministry of Health-National Leishmaniasis Surveillance Services to the PAHO as published in PAHO, leishmaniasis, epidemiological report in the Americas, Washington, PAHO, 2019. Available at: www.paho.org/leishmaniasis. PAHO = Pan American Health Organization. This figure appears in color at www.ajtmh.org.

