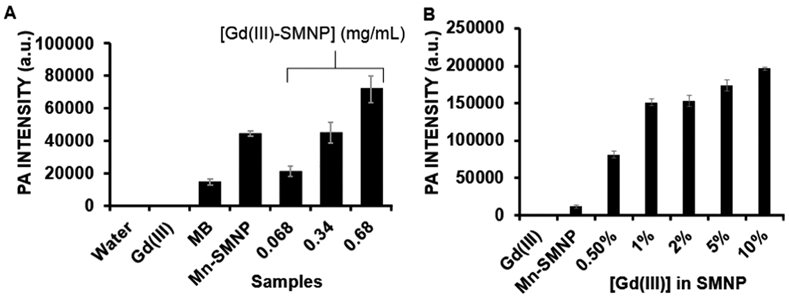
Figure 3.

Photoacoustic (PA) intensity of Gd(III)-doped SMNPs is dependent on the concentration of SMNPs and Gd(III). (A) Photoacoustic intensity data, where 0.68, 0.34, and 0.068 represent the 5% Gd-SMNP concentrations (mg/mL). Mn(III)-SMNPs without Gd(III) doping (0.68 mg/mL), MB (0.4 mM), H2O, and Gd(III) (40 mg/mL) are controls. (B) Photoacoustic intensity data with constant Mn-SMNP concentration, where 0.5–10% represent the concentration of Gd(III) in Mn-SMNPs. Nanoparticle concentration for all is 0.2 mg/mL. The error bars represent the standard deviation of the ROIs (n = 8).
