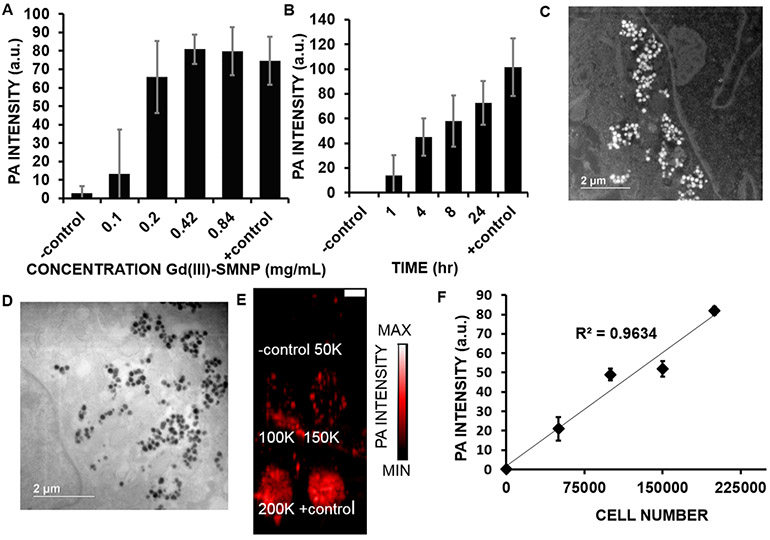
Figure 4.
Optimization of hMSC labeling parameters. (A) Increasing concentrations of nanoparticles (0.1–0.84 mg/mL of Gd(III)-SMNPs) were used to label 150 000 hMSCs; the photoacoustic signal increased accordingly. For panels (A) and (B), unlabeled hMSCs were the negative control. Gd(III)-SMNPs (0.152 μmol/mL Gd(III)) were the positive control. (B) The effect of incubation time on photoacoustic intensity of 150 000 hMSCs treated with 0.42 mg/mL of Gd(III)-SMNPs. The photoacoustic intensity increased as time increased from 1 to 24 h. *Indicates p-value <0.05. (C) Dark-field scanning transmission electron microscopy (STEM) of hMSCs treated with Gd(III)-SMNPs (4 h, 0.42 mg/mL), where the white dots indicate the Gd(III)-SMNPs. (D) TEM microscopy of hMSCs treated with Gd(III)-SMNPs (4 h, 0.42 mg/mL), where the black dots indicate the Gd(III)-SMNPs. (E) Photoacoustic imaging data of hMSCs labeled with Gd(III)-SMNPs. The photoacoustic intensity increased upon increasing the incubation time from 1 to 24 h, suggesting increased internalization of the particles with increasing time. The scale bar represents 1 cm. (F) Photoacoustic intensity data of 0–200 000 hMSCs labeled with Gd(III)-SMNPs showed a linear relationship between cell number and photoacoustic intensity.

