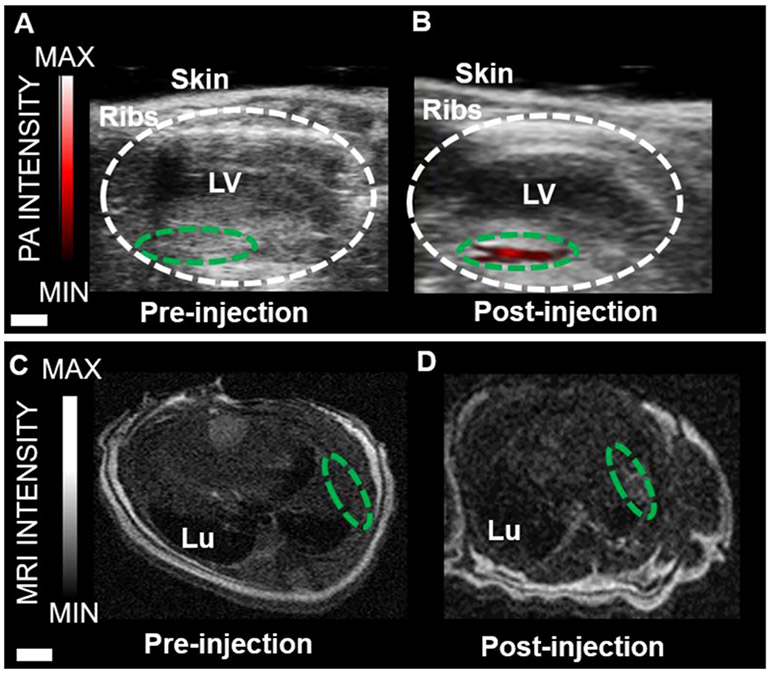
Figure 5.
Photoacoustic and MR imaging of Gd(III)-SMNPs-labeled hMSCs implanted into mouse hearts. (A) Photoacoustic imaging of the longitudinal axis view of live mouse heart pre-injection. The area circled in white represents the left ventricle (LV). The area circled in green represents the area of the left ventricle wall before injection. (B) Photoacoustic imaging of the longitudinal axis view of a live mouse heart post-injection. For this, 500 000 hMSCs labeled with Gd(III)-SMNPs were injected. The green-circled area shows the increase in photoacoustic imaging intensity (red). (C) Transverse MRI view of a mouse heart pre-injection. The green-circled area represents the LV wall. Lu is the lung. (D) Transverse MRI view of a mouse heart post-injection. For this, 500 000 hMSCs labeled with Gd(III)-SMNPs were injected. The green-circled area shows the increase in MRI signal intensity in the LV wall. The scale bar in A and B represents 2 mm; the scale bar for C and D represents 5 mm.

