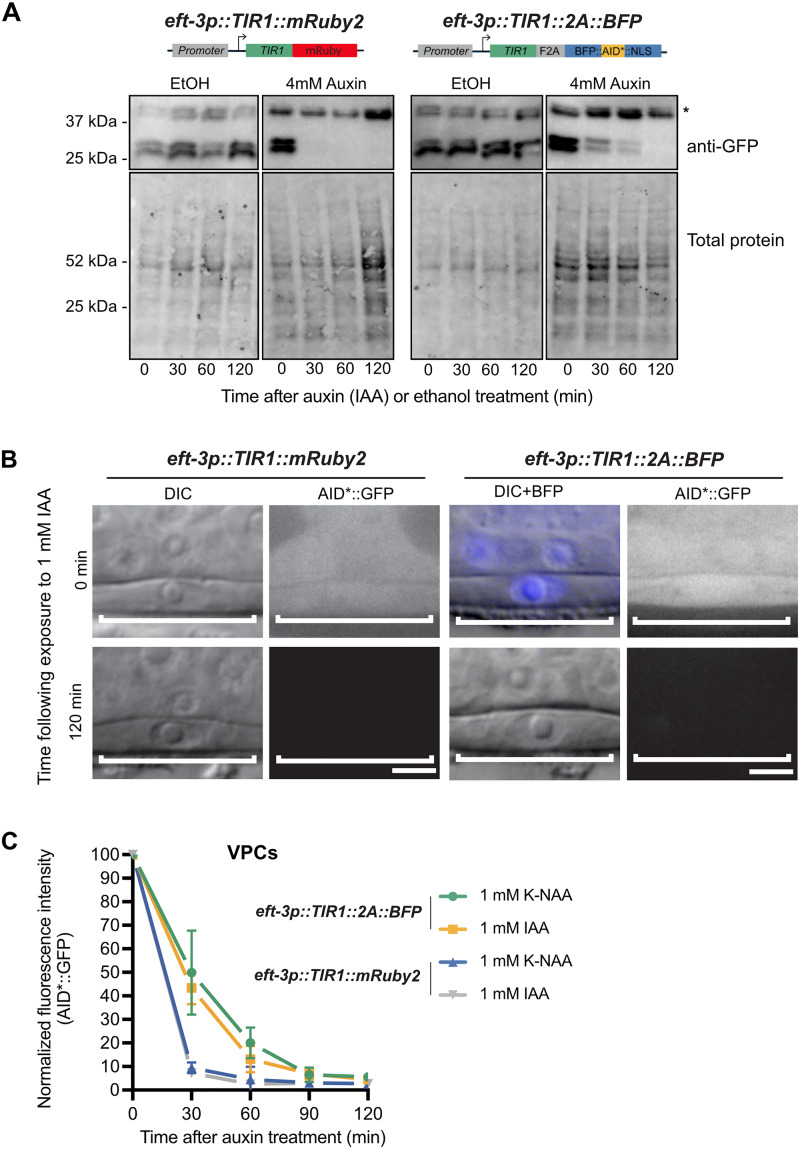
Figure 4 .
eft-3p::TIR1::F2A::BFP::AID*::NLS depletes AID*::GFP to the same extent as eft-3p::TIR1::mRuby2 but produces a slower rate of degradation. (A) Western blots detecting AID*::GFP after exposure to IAA or EtOH (control). An AID*::GFP reporter strain was crossed to either eft-3p::TIR1::mRuby2 (left) or eft-3p::TIR1::F2A::BFP::AID*::NLS (right) and then exposed to 4 mM IAA or EtOH for 0 min, 30 min, 60 min, or 120 min. Anti-GFP blots (top) showing background band (marked with *) and a doublet at approximately 27 kDa, consistent with the predicted size of GFP. Created with BioRender.com. (B) Representative images of AID*::GFP depletion in animals carrying either eft-3p::TIR1::mRuby2 or eft-3p::TIR1::F2A::BFP::AID*::NLS. For animals expressing eft-3p::TIR1::F2A::BFP::AID*::NLS, an overlay of DIC and BFP images is provided. DIC and corresponding GFP images of VPCs (brackets) from L3 larvae at the P6.p 1-cell stage. Animals were treated with 1 mM IAA for the specified time and then imaged to visualize loss of AID*::GFP. Representative images from additional timepoints can be found in Supplementary Figure S2. Scale bars represent 5 µm. (C) AID*::GFP degradation kinetics. Rates of degradation were determined by quantifying AID*::GFP levels in VPCs of animals as described above. Animals were exposed to 1 mM K-NAA or IAA from 0 to 120 minutes at intervals of 30 min. The graph depicts the mean normalized fluorescent intensity from 10 or more animals from a single experimental replicate. Error bars indicate standard deviation.

