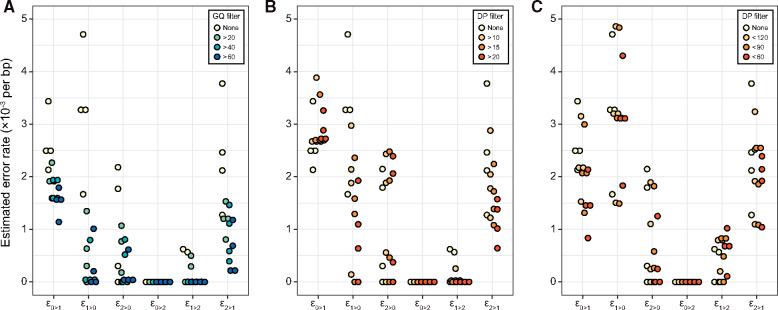
Figure 3.
Error rates estimated from sequencing four pedigrees of owl monkeys. Each point represents an estimate from one pedigree with genotypes filtered as described in the legend. Estimated genotyping error rates consistently decline with the stringency of the (A) minimum GQ filter and (B) minimum and (C) maximum depth filters.

