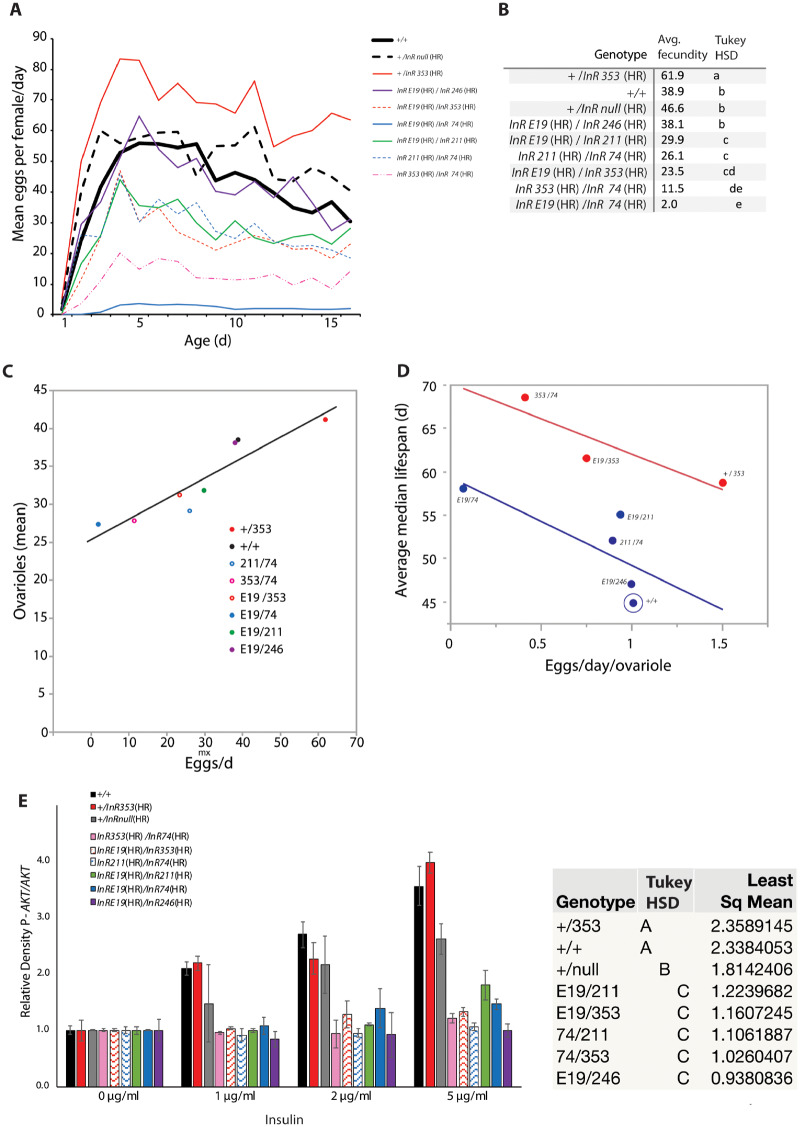
Figure 7.
Fecundity and insulin-simulated pAkt. (A) Mean number of daily eggs laid from eclosion (age 0) through 15 days. (B) Average of daily fecundity. Genotypes not connected by same letter are significantly different, ANOVA with Tukey HSD post hoc analysis. (C) Regression of genotype mean ovariole number upon average fecundity; R2 = 0.85, F = 34.1, P < 0.001. (D) With InR353(HR) as a covariate, regression of genotype lifespan (average of median lifespan is calculated among independent cohorts) and egg production per ovariole (average daily fecundity/mean ovariole number). ANCOVA: β(fecundity/ovariole) = −9.15, t = −2.58, P = 0.061; β (InR353) = 6.23, t = 4.25, P = 0.013; β (fecundity/ovariole x InR353) = 1.01, t = 0.28, P = 0.79). (E) Quantity of phosphorylated Akt (pAKT) measured from fat body stimulated by human insulin; mean (SE) from densitometry of two independent immunoblots relative to total Akt of each sample, normalized to mean of unstimulated tissue. Two-way ANOVA; genotype, dose, and genotype-by-dose interaction, all effects P < 0.0001. Squares mean genotype differences not connected by same letter are significantly different (P < 0.05); Tukey HSD post hoc analysis.

