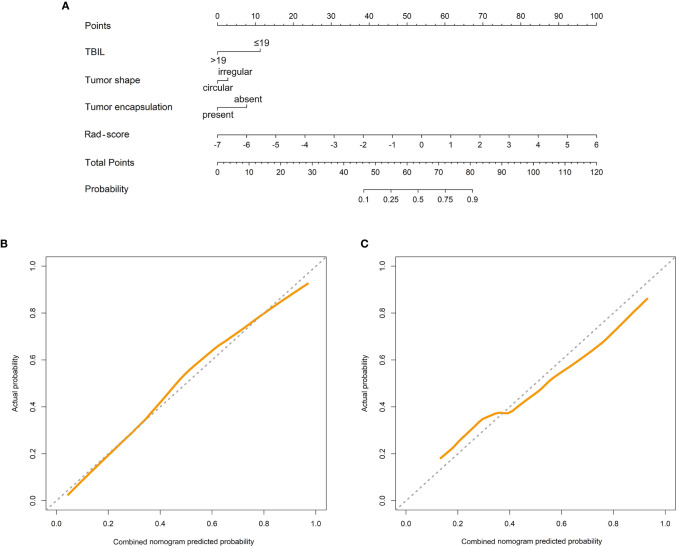
Figure 5.
Combined nomogram (A). The combined nomogram incorporated total bilirubin (TBIL), tumor shape, tumor encapsulation, and the radiomics score (rad-score). Calibration curves of the combined nomogram in the training cohort (B) and the validation cohort (C). The y-axis represents the actual result, and the x-axis represents the predicted probability. The diagonal dashed line indicates the ideal prediction by a perfect model. The solid line indicates the predictive performance of the model. If the solid line is closer to the diagonal dashed line, it means a better prediction.

