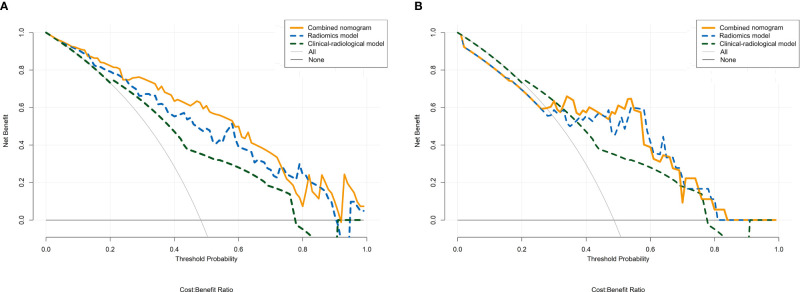
Figure 6.
Decision curve analysis for the radiomics model, clinical-radiological model, and combined nomogram in the training cohort (A) and the validation cohort (B). The y-axis represents the net benefit, and the x-axis represents the threshold probability. The radiomics model, clinical-radiological model, and combined nomogram obtained more benefit than either the treat-all-patients scheme (gray line) or the treat-none scheme (horizontal black line) within certain ranges of threshold probabilities for predicting therapeutic response to TACE in HCC.

