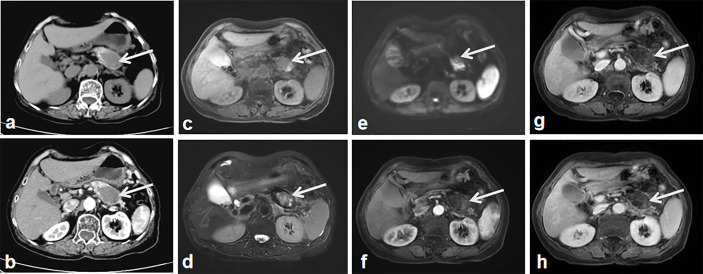
Figure 2.
The second imaging. CT without contrast administration show the significantly enlarged tumor mass with heterogeneous components of central cystic low attenuation, peripheral solid isointensity and small patchy calcification (A, arrow). Contrast-enhanced CT shows the tumor mass with intermediate enhancement of the peripheral component and the non-enhanced cyst-like central area (B, arrow). MR T2 (C) and T2 weighted images (D) show heterogeneous hyper-signal intensity and hypo-signal intensity in the central area of the tumor (arrow). DWI shows the apparent diffusion restriction-induced heterogeneous hypersignal intensity (E, arrow). Contrast-enhanced MR weighted images of arterial (F), portal (G) and equilibrium phase (H) show the tumor mass with intermediate enhancement of the peripheral component, the non-enhanced cyst-like central area (arrows).

