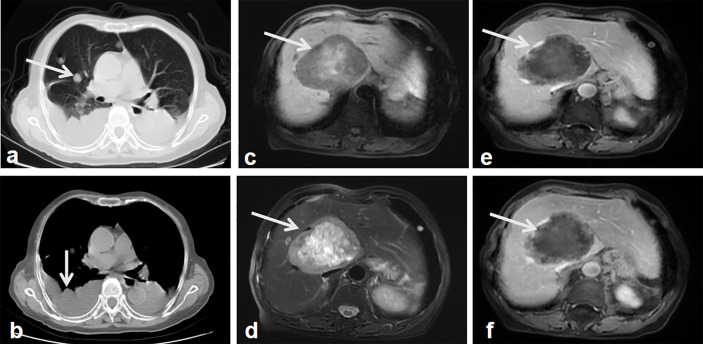
Figure 4.
Follow-up images after surgery. Lung CT shows multiple nodules in the lung and thoracic effusion, which indicate the lung and possible pleural metastasis (A, B, arrow). MR T1 weighted images show a well-demarcated, heterogeneous hypointense signal tumor in the right lobe of the liver with patchy hypersignal intensities in the central of the tumor (C, arrow). MR weighted images show the tumor mass with heterogeneous hypersignal intensities (D, arrow). Contrast-enhanced MR weighted images of arterial (E), portal phase (F) show the tumor mass with intermediate enhancement of the peripheral component, the non-enhanced hypointense signal central area (arrows).

