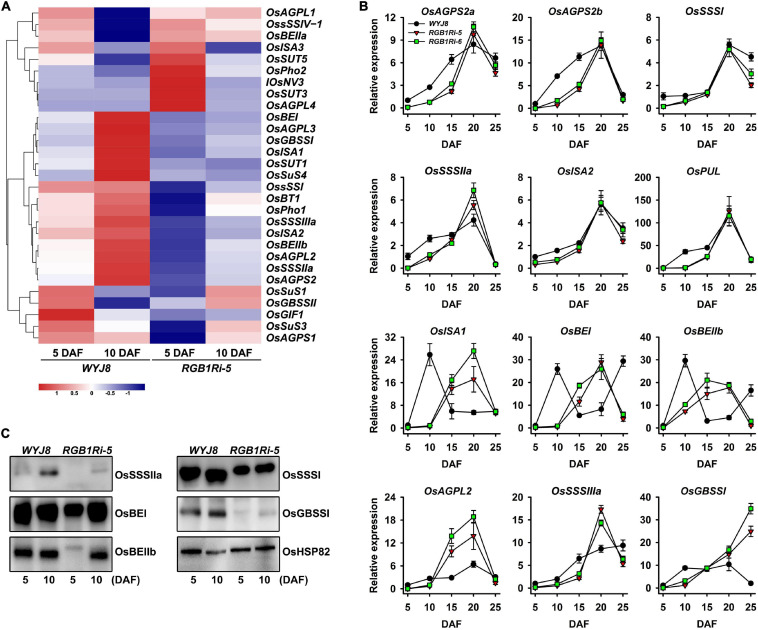
FIGURE 2.
Expressional profiles of sucrose metabolism and starch synthesis related genes during grain filling stage of WYJ8 plant and RGB1Ri lines. (A) Heat maps of differentially expressed genes (DEGs) involved in the starch biosynthesis. The maps were plotted using the value of RPKM for each gene in the different samples: blue indicates low values; red indicates high values. The indicated scale is the log2 value of the normalized level of gene expression. (B) qRT-PCR analysis showing the changes of genes encoding sucrose metabolism and starch biosynthesis-related enzymes during grain filling (from 5 to 25 DAF). (C) Western blotting assay showing the changes of the levels of several enzymes/proteins related to starch biosynthesis at the early stage of grain filling (5 and 10 DAF).

