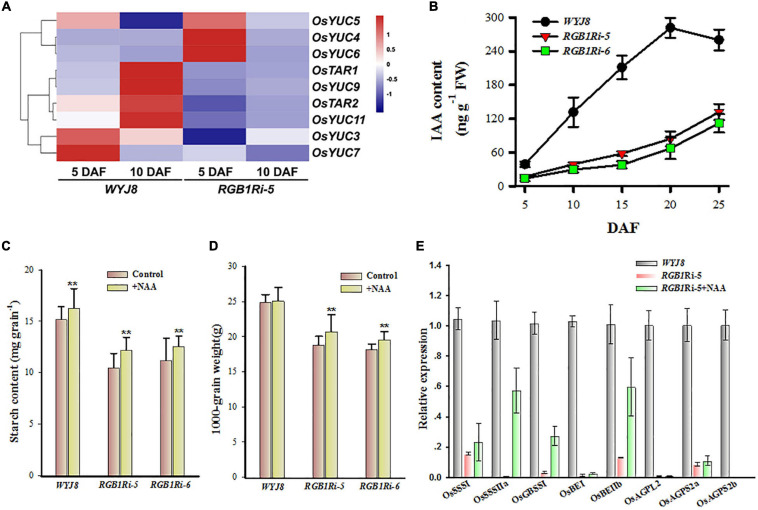
FIGURE 3.
Expressional profiles of auxin biosynthesis-related genes and changes in IAA in grains of WYJ8 plant and RGB1Ri line and effects of application of NAA on starch biosynthesis. (A) Heat maps of differentially expressed genes (DEGs) involved in auxin biosynthesis. The maps were plotted using the value of RPKM for each gene in the different samples: blue indicates low values; red indicates high values. The indicated scale is the log2 value of the normalized level of gene expression. (B) Changes in IAA level in rice endosperm cells of different genotypes during grain filling stage. (C) Effects of exogenous auxin (NAA) application on starch accumulation of grains of different genotypes. (D) Effects of exogenous auxin (NAA) application on grain weight of different genotypes. (E) Effects of exogenous auxin (NAA) application on the expression of genes related to sucrose metabolism and starch biosynthesis at 10 DAF. Data are shown as means ± SDs (n = 5). **Means significant differences when P < 0.01.

