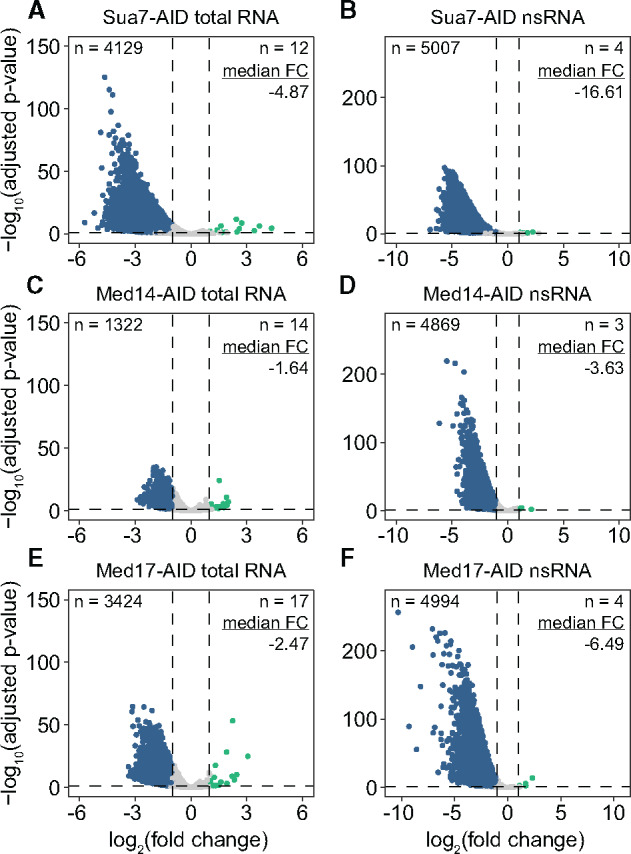
Figure 2.

Architectural Mediator subunit depletion results in global transcriptional downregulation. (A and B) Volcano plots comparing the fold changes (FCs) and adjusted P-values of 5080 RNAPII-transcribed genes in the (A) total and (B) nsRNA fractions after Sua7 depletion. A FC cutoff of 2 with an adjusted P-value threshold of 0.05 was used to assess significance. Significantly downregulated genes are colored blue and significantly upregulated genes are colored teal. Numbers of significantly downregulated and upregulated genes as well as the median linear FC of all genes are given. (C and D) Same as (A and B) but for Med14 depletion. (E and F) Same as (A and B) but for Med17 depletion.
