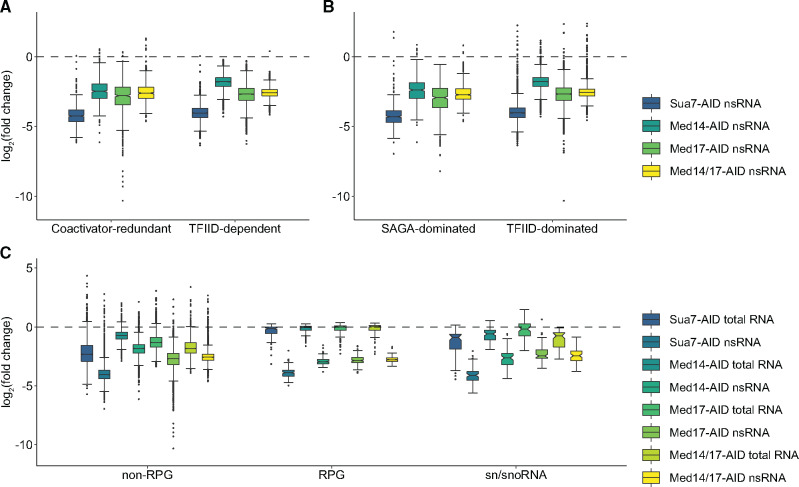
Figure 4.
Gene-specific effects of Mediator subunit depletion. (A and B) Boxplots of average log2(FCs) in nsRNA levels following Sua7, Med14, Med17, or Med14/17 depletion for genes classified as (A) coactivator redundant or TFIID-dependent or (B) SAGA or TFIID-dominated (exclusive of RPGs). (C) Boxplots of average log2(FCs) in total and nsRNA levels following Sua7, Med14, Med17, or Med14/17 depletion for all non-RPG protein coding genes, RPGs, and sn/snoRNAs. Whiskers represent the smallest and largest values up to IQR * 1.5. Notches represent 1.58 * IQR/sqrt(n), which equates to a ∼95% confidence interval for comparing medians.

