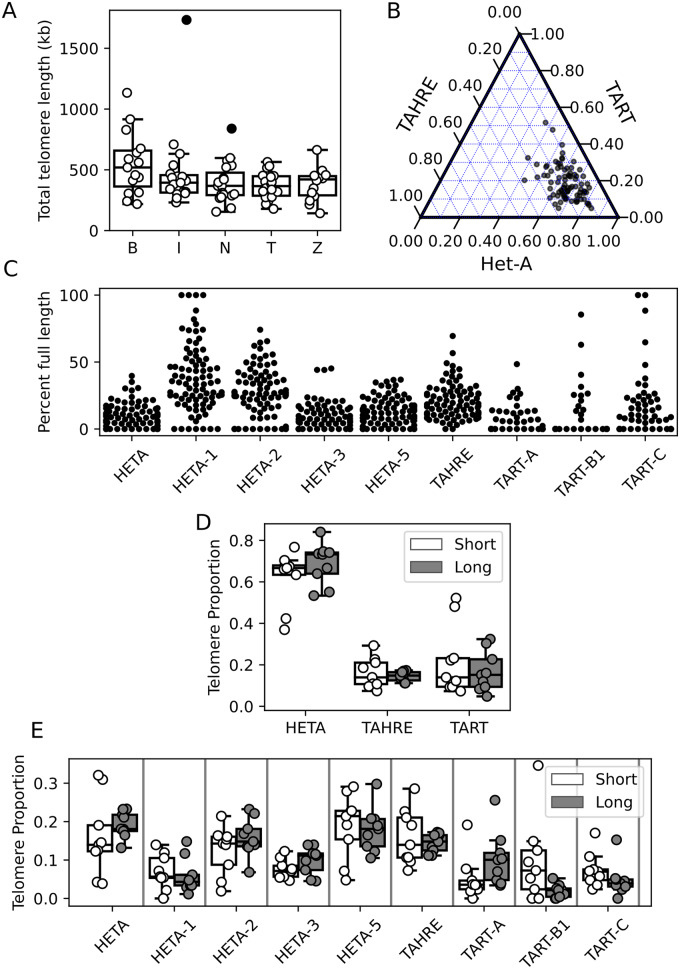
Figure 2.
Telomeres are highly dynamic in Drosophila melanogaster. (A) Telomere length distribution (in kb) as estimated from HTT sequence abundance for each strain, grouped by population. Filled circles represent outlier strains. B: Beijing, I: Ithaca, N: Netherlands, T: Tasmania, Z: Zimbabwe. (B) A ternary plot depicting the proportion of each HTT family in each GDL strain. The angle of the tick on each axis indicates the corresponding gridline for that HTT family. (C) Proportion of full-length elements per subfamily per strain. (D) Telomere composition depicted by proportion of total telomere length per HTT subfamily as estimated from copy number. White corresponds to short telomere strains (bottom 10%), gray to long telomere strains (top 10%). (E) Telomere composition depicted by proportion of total telomere length per HTT family as estimated from copy number. White and gray are the same as in (D).

