Figure 3.
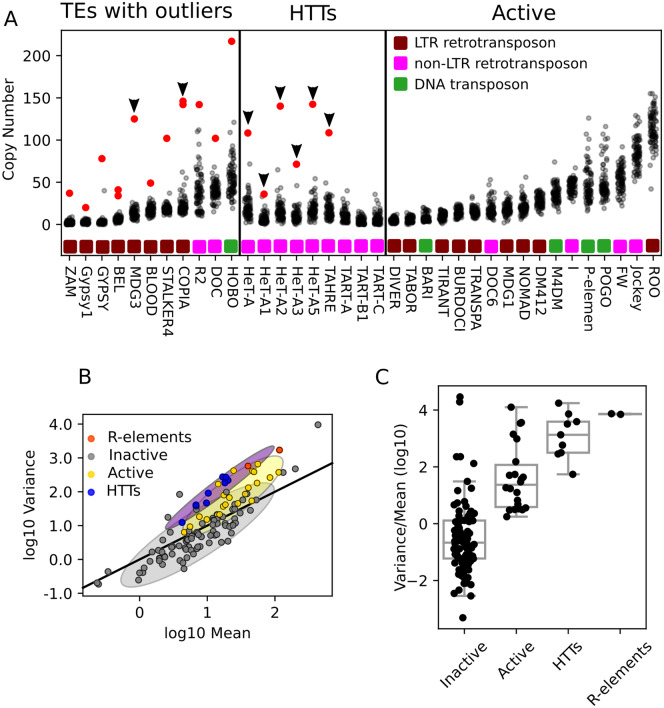
Comparing HTT variability to other TEs within Drosophila melanogaster. (A) Copy number of selected TEs per strain as estimated from junctions. Each dot indicates the copy number of a TE family in a single strain, and red dots indicate strains with extreme copy-number expansions (four standard deviations greater than the mean). TEs are grouped as: Left, TEs with copy number outliers; middle, HTTs; right, all other active TEs. Outliers occurring in strain I01 are indicated with arrows. (B) Scatter plot showing the relationship between mean copy number as estimated from junction data of TE families (log scale) and their variance (log scale) across the GDL. Designations of active and inactive TEs are from prior estimates of sequence divergence and population frequency as described in the Materials and Methods. Solid line represents the expected relationship under the assumption of little variation in population frequency and low linkage disequilibrium among insertions. Shaded regions summarize the distributions of mean and variance for inactive (gray), active (yellow), and the HTT and R-elements (purple) TE families, covering two standard deviations of bivariate Gaussians matched to the moments of the data they are approximating. (C) Boxplots depicting the distribution of variance-to-mean ratios (log10) in each of the four categories of the TEs.

