Figure 6.
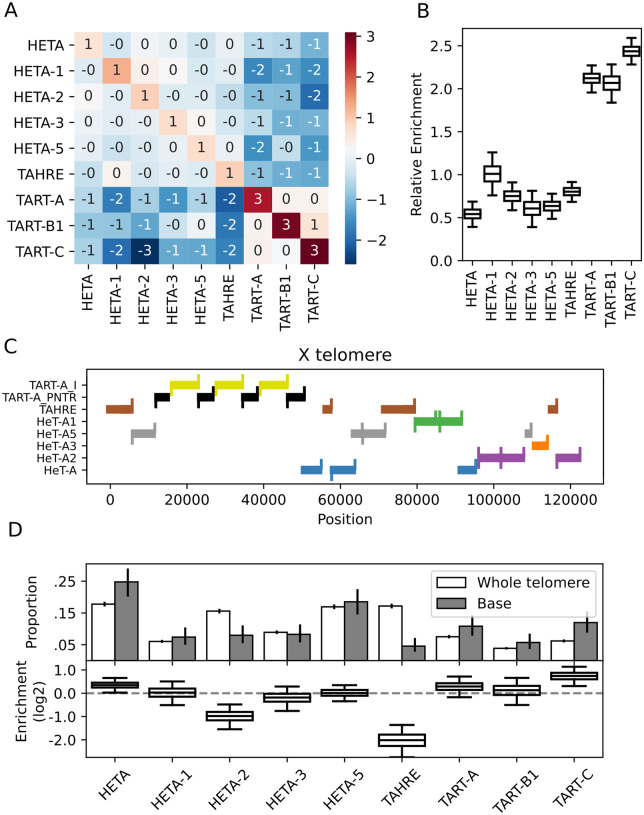
HTT insertions tend to be enriched adjacent to themselves. (A) The observed frequency with which two HTTs neighbor each other relative to the expected frequency (log2). (B) Boxplots of the posterior distributions describing the degree to which elements tend to neighbor themselves (log2). The whiskers reflect the 95% credible intervals. (C) A visualization of the HTT subfamilies, depicted as thick bars, in the X chromosome telomere of the Release 6 reference. We depict alignments with at least 90% identity to the consensus; if a region is homologous to two elements, we assign it to the element with the greatest homology, which was only an issue due to some homology between TART-A and TART-C. The upward ticks indicate the 3ʹ-end of an element and the downward ticks the 5ʹ-end; a full-length insertion has both ticks. TART-A_PNTR is the TART-A Perfect Near-Terminal Repeat. (D) Top: The observed proportion with which each subfamily is found anywhere in the telomere (white) or is the first HTT found at the base of a telomere (gray). The error bars are 95% credible intervals computed analytically for Dirichlet-Multinomial models with uniform priors. Bottom: Boxplots summarizing posterior samples of the relative enrichment (log2) of each subfamily at the base of the telomere, accounting for telomere composition differences across strains. The whiskers span the 95% credible interval, determined as quantiles of the posterior sample.

