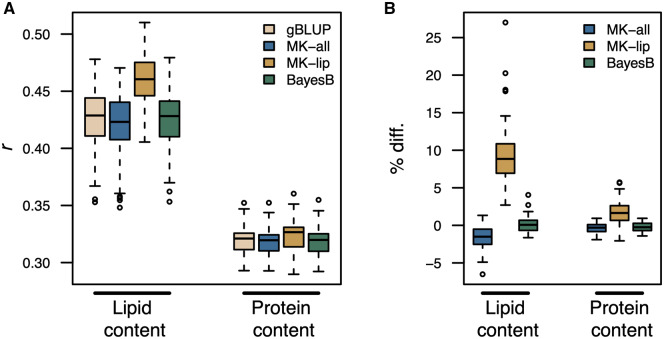
Figure 5.
Genomic prediction for lipid and protein content measured via NIRS. Prediction accuracy was assessed using fivefold cross validation with 50 resampling runs. (A) The distribution of Pearson’s correlation (r) coefficients between observed phenotypes and genetic values for each fatty acid compound. (B) The percent difference (% diff.) in prediction accuracy for the multi-kernel (MK) and BayesB approaches relative to genomic BLUP (gBLUP). The suffixes “-all” and “-lip” indicate models where the biologically informed kernel was constructed from markers associated with any latent factor or lipid-enriched factors, respectively. Three-hundred thirty lines used in this study were also used for factor analysis of metabolomic data.

