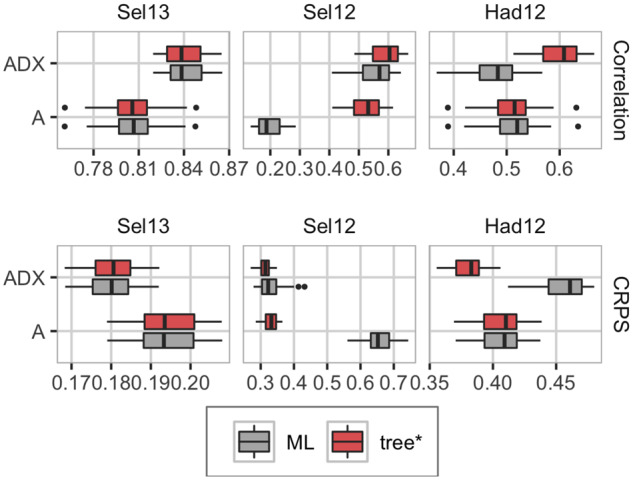
Figure 6.

Phenotype prediction ability measured with correlation (top; high value desired), and CRPS (bottom; low value desired) from three of the trials in the real case study (boxplots show variation over the cross-validations and folds). Left: Sel13 (1739 observations), middle: Sel12 (834 observations), right: Had12 (1738 observations).
