Figure 2.

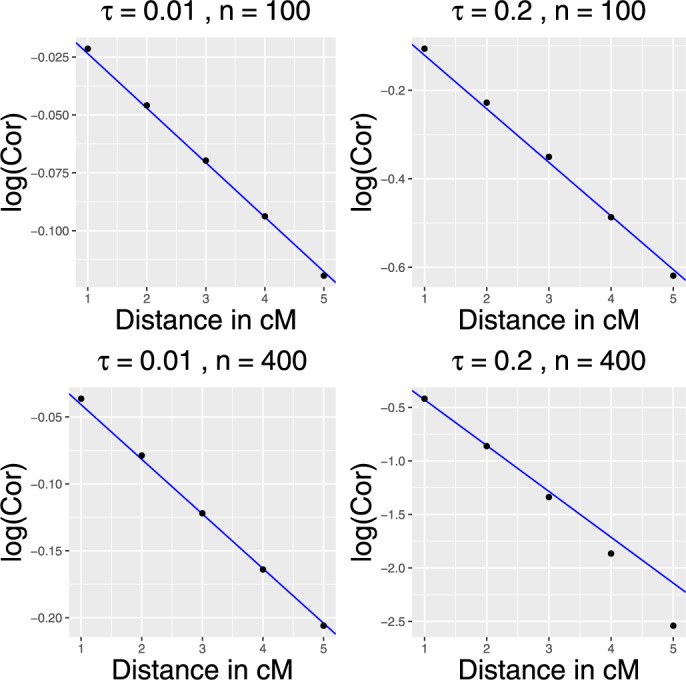
The logarithms of correlations between t-values as the function of the genetic distance between markers (in cM) for the polygenic standard deviation and 0.2, n = 100 and 400, and σ = 1.

The logarithms of correlations between t-values as the function of the genetic distance between markers (in cM) for the polygenic standard deviation and 0.2, n = 100 and 400, and σ = 1.