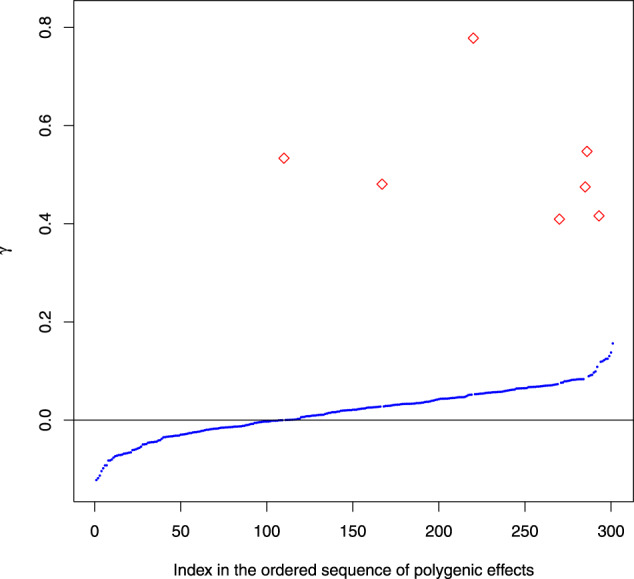
Figure 5.

The comparison between the magnitudes of the falsely detected ghost QTL (red diamonds) and the respective values of the simulated polygenic effects (γ, blue points). The X axis represents the indices of genome locations in the sequence sorted according to the magnitude of the polygenic effects.
