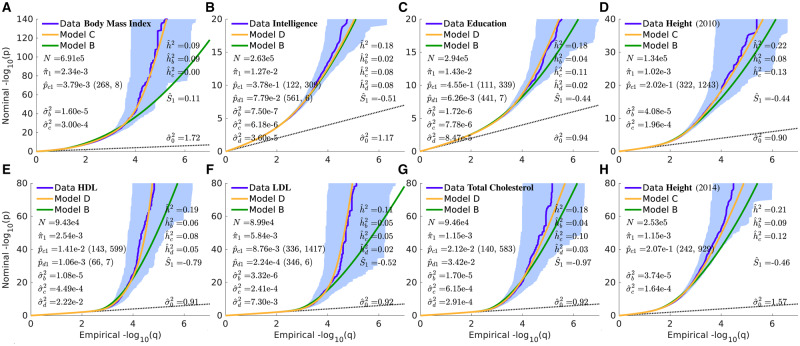
Figure 3.
QQ plots of (pruned) z-scores for quantitative phenotypes (dark blue, 95% confidence interval in light blue) with model prediction (yellow): (A) Body Mass Index; (B) Intelligence; (C) Education; (D) Height (2010); (E) High-density Lipoprotein; (F) Low-density Lipoprotein; (G) Total Cholesterol; and (H) Height (2014). See Supplementary Figures S23–S29. For HDL, for all L; for bipolar disorder and LDL, for all L. See caption to Figure 2 for further description. See also Supplementary Figure S2, where the y-axis is restricted to . For (A) BMI, see also Supplementary Figure S37.

