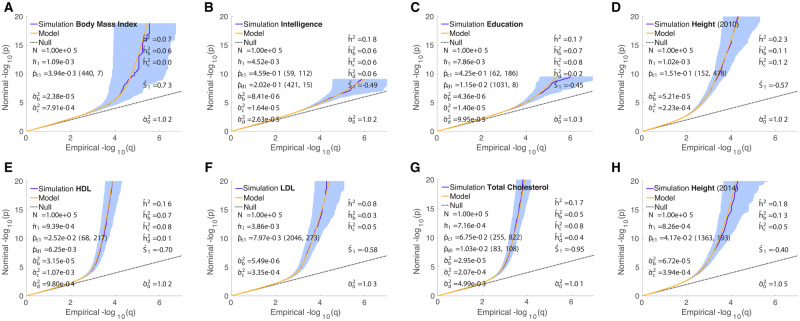
Figure 7.
QQ plots of (pruned) z-scores for simulated quantitative phenotypes (dark blue, 95% confidence interval in light blue) with model prediction (yellow). See Figure 3. See caption to Figure 2 for further description. See Appendix Tables C1 and C2 for a comparison of numerical values between model estimates for real phenotypes and Hapgen-based simulations where the underlying distributions of simulation causal effects were given based on the real phenotype model parameters (with ).

