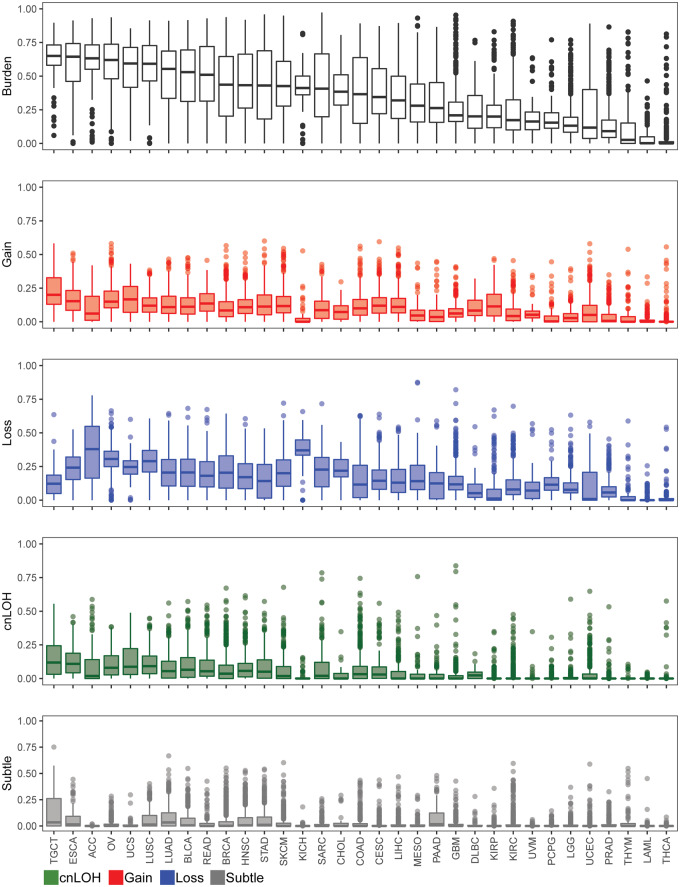
Figure 2.
The distribution of genomic AI burden across 33 tumor sites in TCGA. We identified regions of AI across 11,074 tumor samples across 33 tumor sites in TCGA. Boxplots representing the distribution of overall genomic AI burden, defined as a percent of the genome exhibiting evidence of AI, are shown for each tumor site. The distribution of genomic burdens for each event type is also shown (red: gain, blue: loss, green: cnLOH, gray: subtle, unclassifiable events). The tumors are ordered by their median overall genomic burden.

