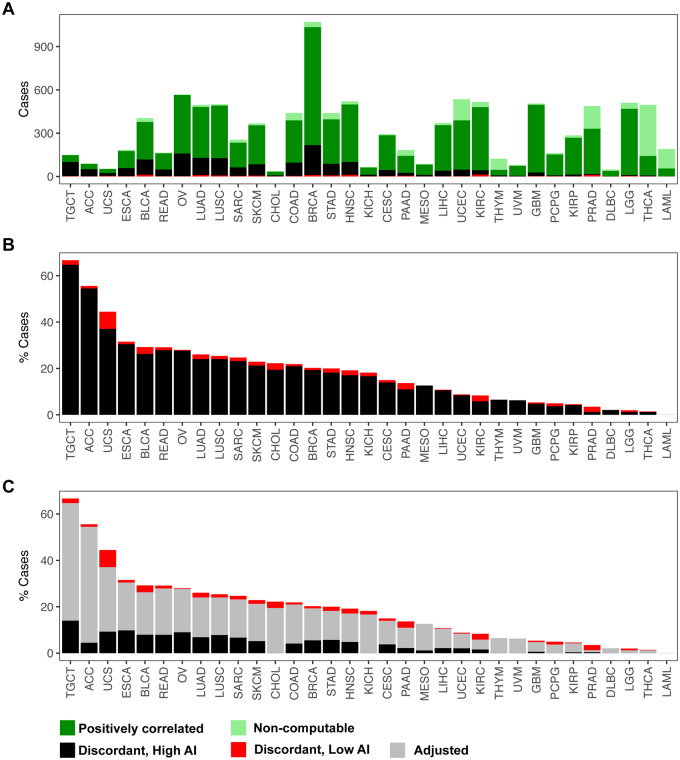
Figure 5.
Identification and adjustment of putative discordant samples between SCNAs inferred from hapLOH with those reported in TCGA. A total of 10,680 tumor samples were assessed for concordance between the two call sets (see Materials and methods). (A) The distribution of positively correlated (dark green) and negatively correlated (black and red) samples for each tumor site is shown as a stacked bar plot. The negatively correlated samples are further divided into two categories, based on their overall AI genomic burden, with cases showing at least 50% of their genome aberrant termed as high AI (black), with the remaining cases annotated as low AI (red). Samples for which correlation was non-computable, based on the absence of at least one event in each call set, are also shown (light green). These cases comprise a vast majority of samples that exhibited no evidence of SCNAs in either of the call sets. (B) A stacked bar plot of the distribution of negatively correlated samples (high AI and low AI) as a percentage of the total number of samples profiled for each tumor site is shown. (C) An automated adjusted procedure was applied on cases identified to be “negatively correlated, high AI” (black). A stacked bar plot of the distribution of samples after applying the adjustment procedure is shown across all tumor sites, with the percent of adjusted cases shown in gray. Tumor sites in all three panels are ordered by their overall percent of putative discordant samples.

