
Figure 3.
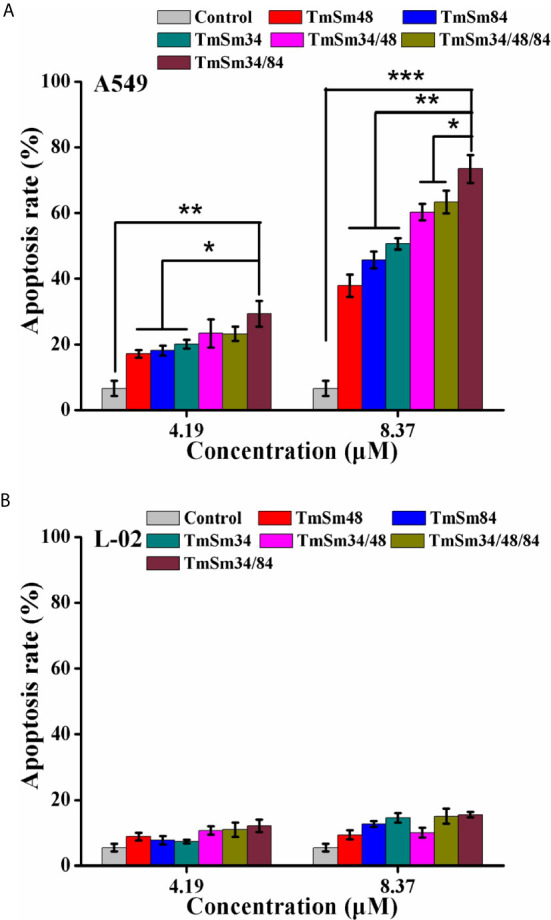
Apoptosis of A549 and L-02 cells were analyzed by flow cytometry. (A) A549 cells were incubated with different TmSm proteins of the same concentrations gradient (0, 4.19, and 8.37 μM) for 24 h. Bar diagram depicting the total percentage of apoptotic cells. (B) L-02 cells were incubated with different TmSm proteins of the same concentrations gradient (0, 4.19, and 8.37 μM) for 24 h. Bar diagram depicting the total percentage of apoptotic cells. Data were expressed as mean ± SD (n = 3). *P < 0.05, **P < 0.01, and ***P < 0.001.