
Figure 3.
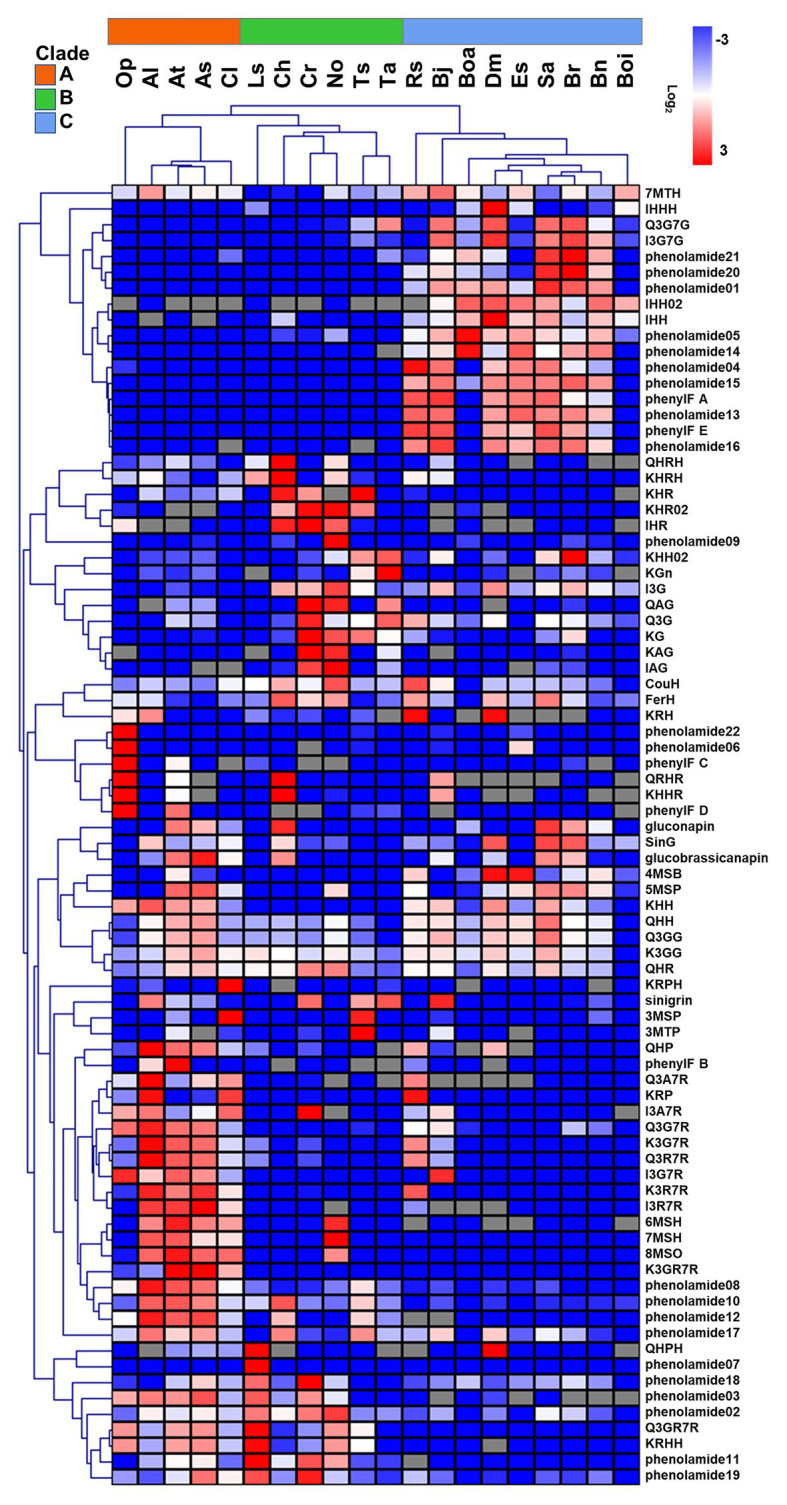
Relative abundance of 82 annotated metabolites in floral organ of 20 genotypes. Color indicates the level of log2 (mean/mean_average). Gray grids indicate no detection. Metabolites and genotypes in heatmap were clustered using hierarchical clustering method (HCL).