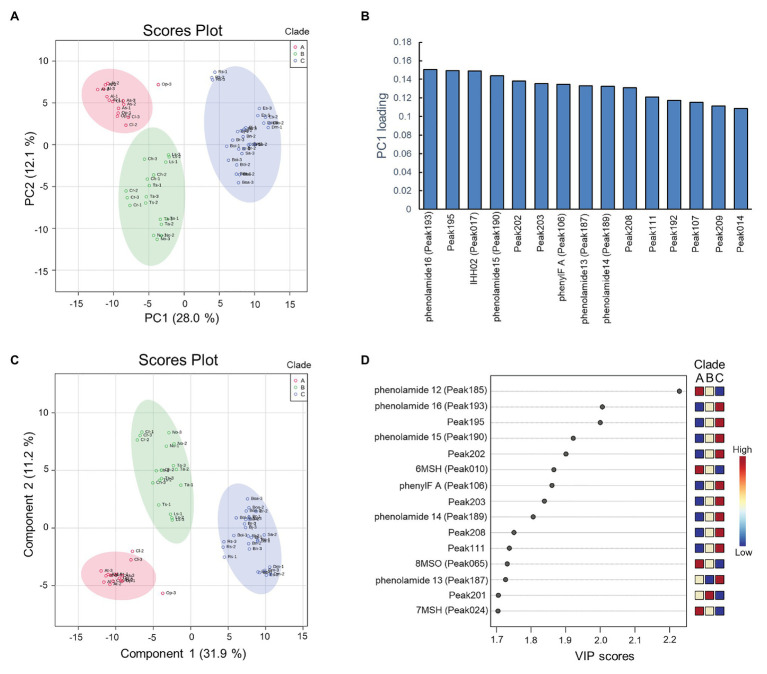
Figure 4.
Results of principal component analysis (PCA) and partial least squares-discriminant analysis (PLS-DA) of the metabolite data. (A) PCA scores plot between the principal component 1 (PC1) and PC2. The explained variances are shown in brackets, colors of circle indicate three replications of metabolite data of species; (B) PCA loading plots between the PC1 and PC2; (C) PLS-DA scores plot between the PC1 and PC2. The explained variances are shown in brackets; (D) Important features identified by variable importance in projection (VIP) scores. The colored boxes on the right indicate the relative concentrations of the corresponding metabolite in each clade.

