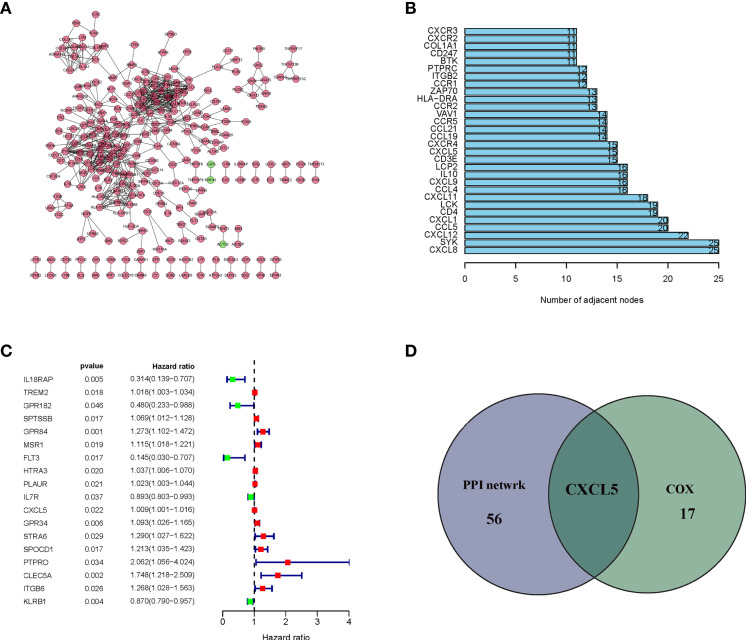
Figure 4.
Protein–protein interaction network and univariate cox. (A) Interaction network constructed with the nodes with interaction confidence value > 0.95; (B) The top 30 genes ordered by the number of nodes; (C) Univariate cox regression analysis with 830 DEGs, listing the top significant factors with P < 0.005; (D) Venn plot showing the common factors shared by leading 30 nodes in PPI and top significant factors in univariate cox.

