
Figure 2.
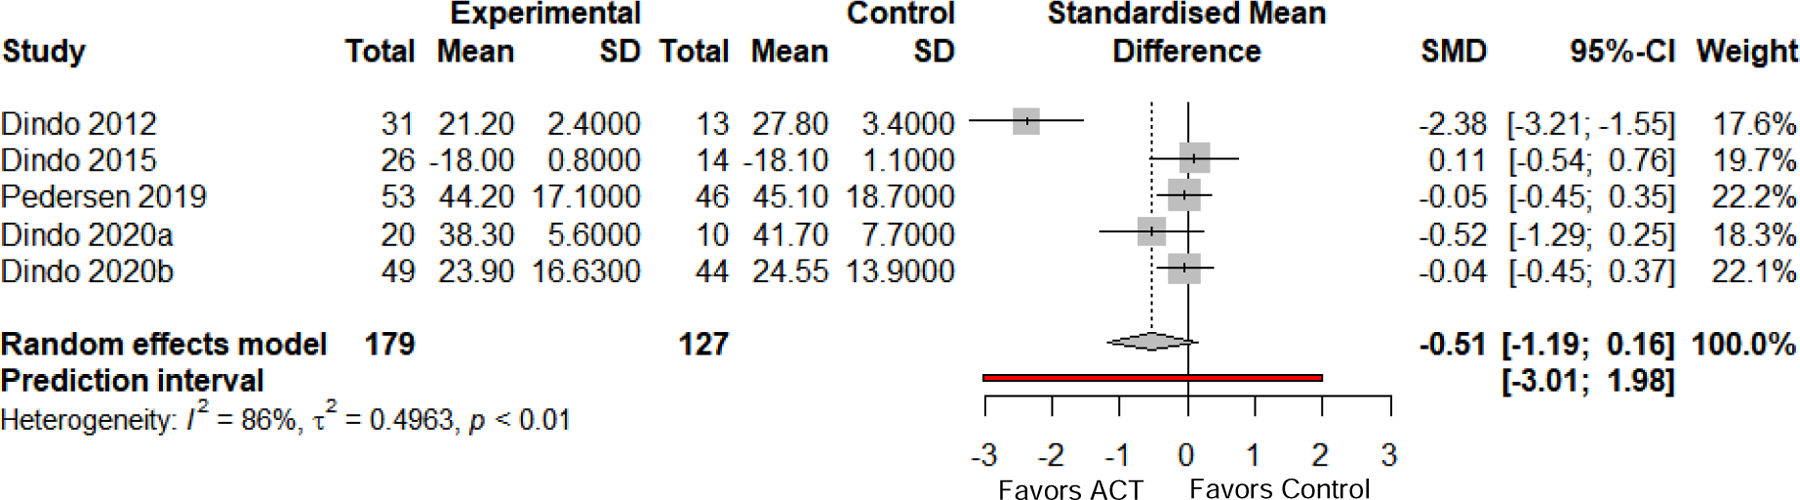
Between-group meta-analysis results and forest plot for functioning-related outcomes at follow-up. Functioning-related outcomes included measures of functioning and well-being. Where studies reported more than one relevant outcome, the general (rather than condition-specific) measure was selected to reduce heterogeneity. Error bars are 95% confidence intervals; dashed line is pooled effect size; red line is prediction interval. SD = standard deviation. SMD = standardized mean difference, calculated as Hedges’ g.