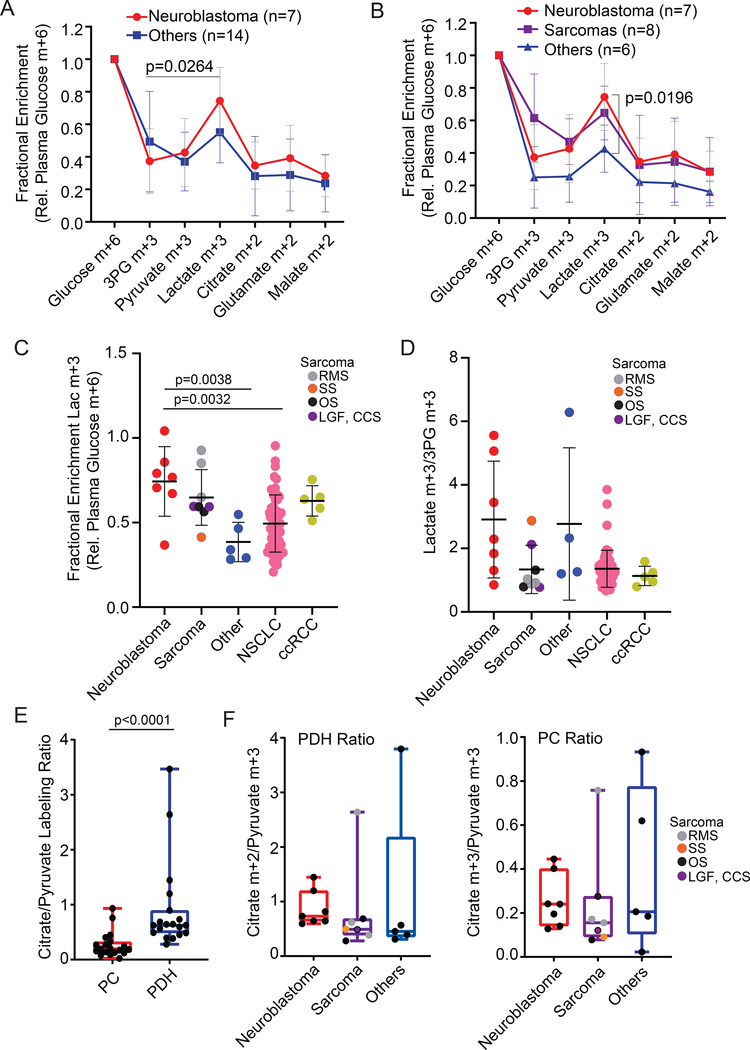
Figure 3: Metabolite labeling reveals evidence of metabolic differences between neuroblastoma and other tumor types.
(A) Fractional enrichment of metabolites extracted from all pediatric tumors in the cohort. Labeling is normalized to the glucose m+6 fraction in plasma at the time of tumor resection. The bar indicates that in neuroblastomas, relative labeling in lactate is higher than relative labeling in 3PG.
(B) Fractional enrichment of metabolites extracted from all pediatric tumors in the cohort. These data are the same as in panel (A), but sarcomas are considered as a separate group. The bar indicates the difference in relative lactate labeling between neuroblastoma and other non-sarcoma tumors.
(C) Fractional enrichment in tumor lactate, normalized to plasma glucose m+6, in pediatric tumors, adult NSCLC and adult ccRCC. NSCLC and ccRCC data include previously-reported patients 24,28 and are displayed here for the purposes of comparing to the new data from pediatric cancers.
(D) Lactate m+3/3PG m+3 labeling ratios in the tumors displayed in (C).
(E) Summary of labeling surrogates for PC activity (citrate m+3/pyruvate m+3 ratio) and PDH activity (citrate m+2/pyruvate m+3 ratio) for all pediatric tumors subjected to [U-13C]glucose infusion.
(F) Comparison of PC and PDH labeling surrogates in different pediatric tumor types.
Abbreviations: Low grade fibromyxoid sarcoma (LGF), osteosarcoma (OS), clear cell sarcoma of the kidney (CCS), rhabdomyosarcoma (RMS), synovial sarcoma (SS).

