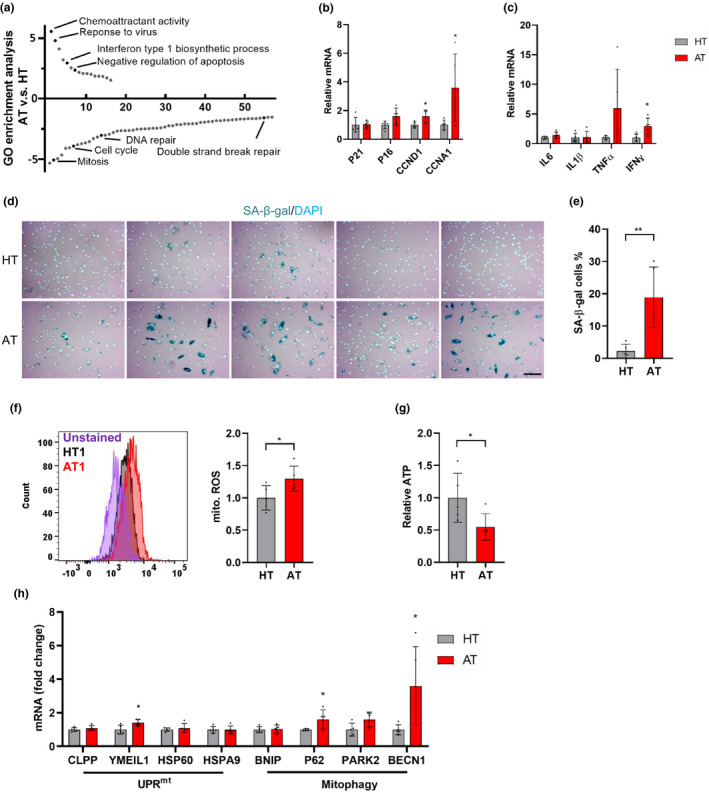
FIGURE 1.

Senescence phenotypes and mitochondrial dysfunction in A‐T fibroblasts. (a) Go term analysis demonstrates up‐ and downregulated signaling pathways in A‐T fibroblasts (AT1‐4), compared with healthy controls (HT1‐4). The specific pathways related to senescence phenotypes in A‐T are highlighted in dark. X‐axis is the pathway number. (b, c) Relative genes expression for senescence (b), and SASP (c) between AT cells and HT cells. P16, p = 0.062. (d, e) The representative SA‐β‐gal staining images (d) and quantification of the percentage of SA‐β‐gal cells (e). Scar bar, 100 µm. (f) Mitochondrial superoxide was measured by Mitosox. The representative Mitosox staining in HT1 and AT1 (left) and quantification of the Mitosox (right) in AT compared with HT cells. (g) Cellular ATP levels in AT and HT cells. (h) Relative gene expression for UPRmt and mitophagy genes in AT compared with HT cells. Data are normalized to GAPDH mRNA transcript levels. Each experiment shows the average of results obtained in triplicate for each cell line. All statistical significance was calculated by Student's t test. Data are shown as mean ± SD. *p < 0.05, **p < 0.01, ***p < 0.001
