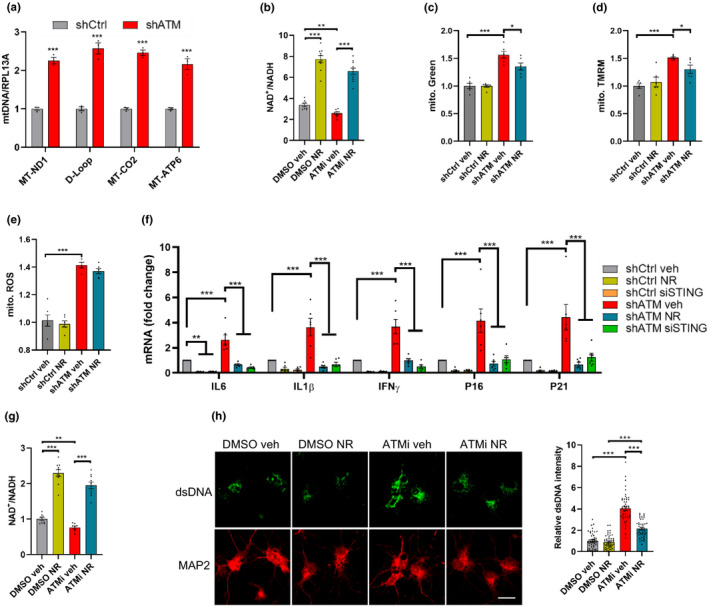
FIGURE 4.

NR ameliorates mitochondrial dysfunction and cytoplasmic dsDNA in neural cells. (a) DNA was harvested from cytoplasmic and nuclear fractions of ATM knockdown or control SH‐SY5Y cells and mtDNA/RPL13A was analyzed by qPCR. n = 3 cultures each group. (b) The ratio of NAD+/NADH in shCtrl and shATM SH‐SY5Y cells. (c–e) Mitochondrial content (c), mitochondrial membrane potential (d), and mitochondrial ROS (e) were measured by flow cytometry in SH‐SY5Y cells. n = 6 cultures per group. (f) qPCR analysis for senescence markers in shCtrl‐ or shATM SH‐SY5Y cells treated with vehicle, NR, or siSTING, including IL6, IL1β, IFNγ, P16, and P21. n = 8 cultures per group. (g) The ratio of NAD+/NADH were analyzed in DMSO‐ or ATMi‐neurons with or without NR treatment. n = 8–10 cultures per group. (h) Immunofluorescence microscopic analysis of dsDNA (green) and neuronal maker MAP2 (red) (left) and quantification of density of dsDNA (right). Scar bar, 10 µm; 47–54 neurons were analyzed for each group. Data are shown as mean ± SEM. *p < 0.05; **p < 0.01; ***p < 0.001 by two‐tailed Student's t test or one‐way ANOVA
