Figure 1.

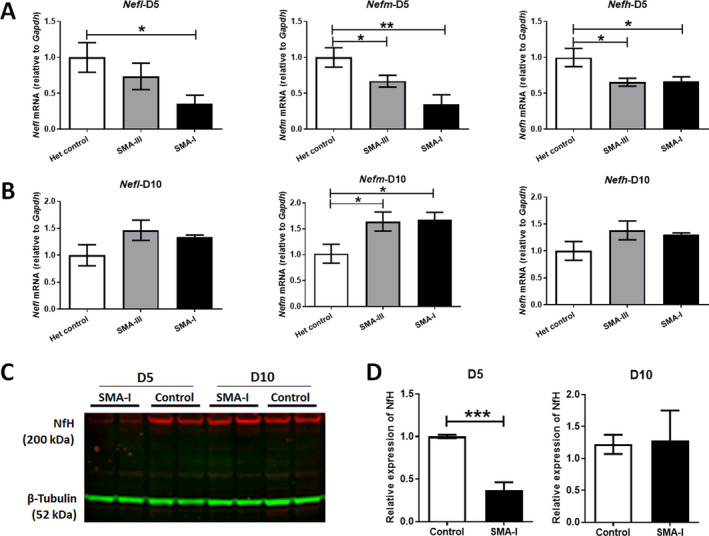
Expression of Nef mRNA transcripts in spinal cord tissues from SMA mice. Quantitative real‐time PCR analysis of Nefh, Nefm and Nefl transcripts, relative to Gaphd, were performed in spinal cord samples collected from the severe SMA type I mice (SMA‐I), mild type III mice (SMA‐III) and unaffected heterozygous littermate controls (Het control) at (A) postnatal day 5 (D5) and (B) postnatal day 10 (D10), respectively (n = 4/group). Data were analysed by one‐way ANOVA followed by post t test. (C) A representative image of western blotting of NfH (200 kDa) in spinal cord samples collected from SMA‐I and het control mice at postnatal day 5 (D5) and day 10 (D10). β‐Tubulin (52 kDa) was used as a loading control. (D) Semi‐quantification of the density of NfH protein bands, relative to β‐tubulin, in SMA‐I and control mice (n = 4/group). Data were analysed by unpaired t test. *p < 0.05, **p < 0.01, ***p < 0.001.
