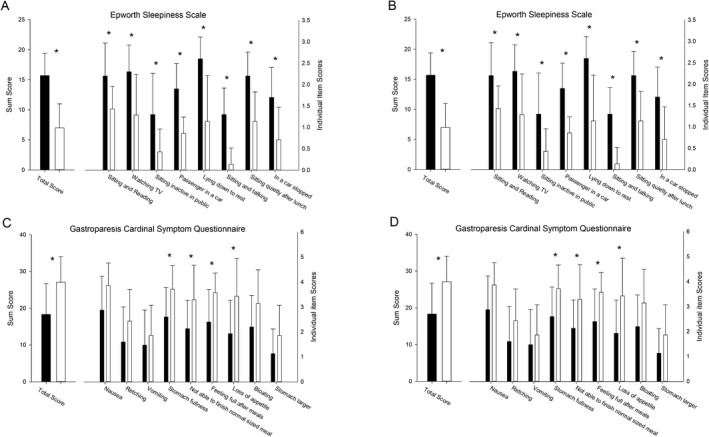
Figure 3.

(A–D) Results of the patient reported outcome questionnaires. (A) REM sleep behavioral disorder questionnaire. The individual item responses are shown on the left Y axis, with the total score shown on the right Y axis. *p < 0.01. (B) Gastroparesis Cardinal Symptom Index. The individual item responses are shown on the left Y axis, with the total score shown on the right Y axis. *p < 0.01. (C) Epworth Sleepiness Scale. The individual item responses are shown on the left Y axis, with the total score shown on the right Y axis. *p < 0.01. (D) Results from the Wood Mental Fatigue Inventory. The individual item responses are shown on the left Y axis, with the total score shown on the right Y axis. *p < 0.01.
