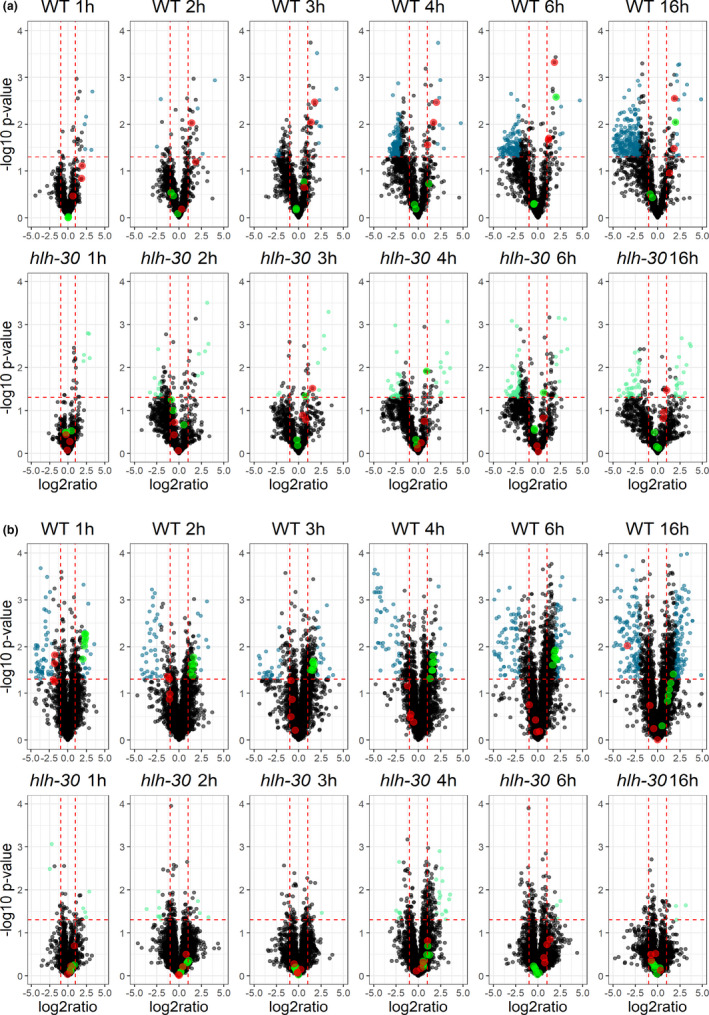
FIGURE 2.

Metabolic and lipidomic changes induced by temporal starvation. (a) Volcano plot displaying changes in the metabolome in response to starvation for the wild‐type and hlh‐30 mutant at each time point. Significant up‐ or downregulated metabolites in wild‐type animals are shown in blue, and in light green for the hlh‐30 animals. Regulation of long‐chain acyl‐carnitines are shown in red and short‐chain acyl‐carnitines are shown in green for both wild‐type and the hlh‐30 mutant. Only, metabolites detected in the positive mode are shown. (b) Volcano plot displaying changes in the lipidome in response to starvation for the wild‐type and hlh‐30 animals at each time point. Significant up‐ or downregulated lipids in the wild type are shown in blue, and in light green for hlh‐30 animals. Regulation of cardiolipins are shown in green and N‐acylethanolamines are shown in red for both wild‐type and hlh‐30 animals. Only, lipid species detected in the positive mode are shown. Metabolites and lipids with a p‐value <.05 and a fold‐change of >2 or <0.5 were considered to be significantly changed
