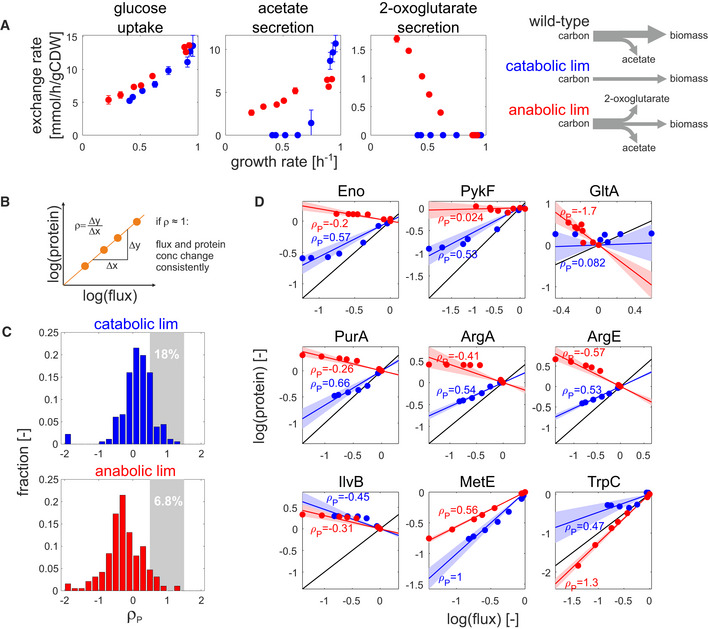
Figure 2. Regulation analysis of flux–protein relationship in nutrient limitations.

-
ASpecific uptake and secretion rates of glucose (left), acetate (middle), and 2‐oxoglutarate (right) in catabolic (blue) and anabolic (red) limitation. Data shown are the mean of three biological replicates, and error bars denote standard deviation.
-
BSchematic description of regulation analysis: The regulation coefficient ρ denotes the degree to which flux and protein concentration of a given reaction change consistently across conditions (ρ = 1: full proportionality of flux and protein changes). See Appendix Text 3 for detailed description.
-
C, DDistribution of protein regulation coefficients (ρP) for catabolic (upper panel) and anabolic (lower panel) limitation. Protein regulation coefficients were determined separately for each limitation by linear regression. For reactions that are associated to more than one protein, the final protein regulation coefficients were calculated as the average regulation coefficients across all measured proteins (total number of considered reactions: 202). The fraction of reactions showing consistent flux and protein changes (regulation coefficients between 0.5 and 1.5) is highlighted by gray areas with corresponding percentages. Individual examples are shown in (D). Blue and red lines denote the estimated regulation coefficient ρ P (calculated by linear regression) between measured flux and protein concentrations for catabolic and anabolic limitation, respectively. Shaded areas denote the standard error of each estimate. Black lines denote full proportionality. Top panel: central metabolic reactions. Middle panel: biosynthetic reactions showing a shift from positive to negative ρP for carbon and anabolic limitation, respectively. Bottom panel: biosynthetic reactions which deviate from this behavior.
